
Information as of February 4, 2018
This report was created by:
- Professor Dmitrii Kornilov, Doctor of Economics, Member of the Russian Academy of Natural Sciences, and Leading Analyst at ICOBox;
- Dima Zaitsev, PhD in Economics, Head of International Public Relations and Business Analytics Department Chief at ICOBox;
- Nick Evdokimov, Co-Founder of ICOBox;
- Mike Raitsyn, Co-Founder of ICOBox;
- Anar Babaev, Co-Founder of ICOBox;
- Daria Generalova, Co-Founder of ICOBox;
This report presents data on the cryptocurrency and ICO market changes during 2017-2018. Special emphasis has been placed on an analysis of the changes that took place in January 2018, including over the last week (January 29-February 4, 2018).
1. General cryptocurrency and digital assets market analysis (by week, month, quarter). Market trends.
1.1 General cryptocurrency and digital assets market analysis (by week, month).
Table 1.1. Trends in capitalization of the cryptocurrency market and main cryptocurrencies from December 1, 2017, to February 4, 2018*
| Parameter | 1-Dec-17 | 1-Jan-18 | MoM, % | 1-Feb-18 | MoM, % | 4-Feb-18 | DoD, % | |
| 1 | Total market capitalization, USD billion | 305.1 | 612.9 | 100.9% | 517.2 | -15.6% | 447.2 | -13.5% |
| 2 | Altcoin market capitalization, USD billion | 134.7 | 376.2 | 179.3% | 344.8 | -8.3% | 292.7 | -15.1% |
| Altcoin dominance, % | 44.1% | 61.4% | – | 66.7% | – | 65.4% | – | |
| 3 | Bitcoin price, $ | 10 198.6 | 14 112.2 | 38.4% | 10 237.3 | -27.5% | 9 175.7 | -10.4% |
| Bitcoin market capitalization, USD billion | 170.4 | 236.7 | 38.9% | 172.4 | -27.2% | 154.6 | -10.3% | |
| Bitcoin dominance, % | 55.9% | 38.6% | – | 33.3% | – | 34.6% | – | |
| 4 | Ethereum price, $ | 445.2 | 755.8 | 69.8% | 1 119.4 | 48.1% | 964.7 | -13.8% |
| Ethereum market capitalization, USD billion | 42.8 | 73.1 | 70.9% | 109.0 | 49.1% | 94.0 | -13.8% | |
| Ethereum dominance, % | 14% | 11.9% | – | 21.1% | – | 21.0% | – | |
| 5 | Bitcoin Cash price, $ | 1 381.8 | 2 534.8 | 83.4% | 1 491.1 | -41.2% | 1 273.2 | -14.6% |
| Bitcoin Cash market capitalization, USD billion | 23.3 | 42.8 | 84.1% | 25.3 | -41.0% | 21.6 | -14.6% | |
| Bitcoin Cash dominance, % | 7.6% | 7% | – | 4.9% | – | 4.8% | – | |
| 6 | Litecoin price, $ | 88 | 231.7 | 163.3% | 163.7 | -29.3% | 160.4 | -2.0% |
| Litecoin market capitalization, USD billion | 4.8 | 12.6 | 165.6% | 9.0 | -28.8% | 8.8 | -1.9% | |
| Litecoin dominance, % | 1.6% | 2.1% | – | 1.7% | – | 2.0% | – | |
| 7 | Smith + Crown Index | 18 058 | 27 543 | 52.5% | 24 709 | -10.3% | 22 262 | -9.9% |
| 8 | Volume (24h) 4 crypto, USD billion | 9.2 | 15.7 | 71.1% | 17.3 | 10.2% | 11.9 | -31.1% |
| Market cap 4 crypto, USD billion | 246.1 | 441.6 | 79.4% | 351.6 | -20.4% | 305.7 | -13.0% | |
| ZAK-4 Crypto index | 3.7% | 3.6% | – | 4.9% | – | 3.9% | – | |
| 4 crypto dominance, % | 80.7% | 72% | – | 68.0% | – | 68.4% | – | |
| 9 | Volume (24h) 8 crypto, USD billion | 10.3 | 17.2 | 67.5% | 19.0 | 10.2% | 14.2 | -25.3% |
| Market cap 8 crypto, USD billion | 263.5 | 488.6 | 85.4% | 393.4 | -19.5% | 341.6 | -13.2% | |
| ZAK-8 Crypto index | 3.9% | 3.5% | – | 4.8% | – | 4.1% | – | |
| 8 crypto dominance, % | 86.4% | 79.7% | – | 76.1% | – | 76.4% | – |
* Data as of February 4, 2018 (all figures calculated at 00:00 UTC)
** Since December 1, 2017, the ZAK-4 index has been calculated using the cryptocurrencies Bitcoin, Ethereum, Ripple, and Bitcoin Cash.
*** When calculating the ZAK-8 index, the cryptocurrencies with the largest capitalization are used. At present (February 4, 2018), the cryptocurrencies Bitcoin, Ethereum, Ripple, Bitcoin Cash, Cardano, Litecoin, Stellar, and NEO are used.
Data source: coinmarketcap.com, https://www.smithandcrown.com
Since the beginning of 2018, cryptocurrency market capitalization has fluctuated by around $485 billion, from a maximum at the start of the year of $835.5 billion (on January 7, 2018) to $348 billion (on February 2, 2018).
Figure 1. Cryptocurrency market capitalization since the start of 2018
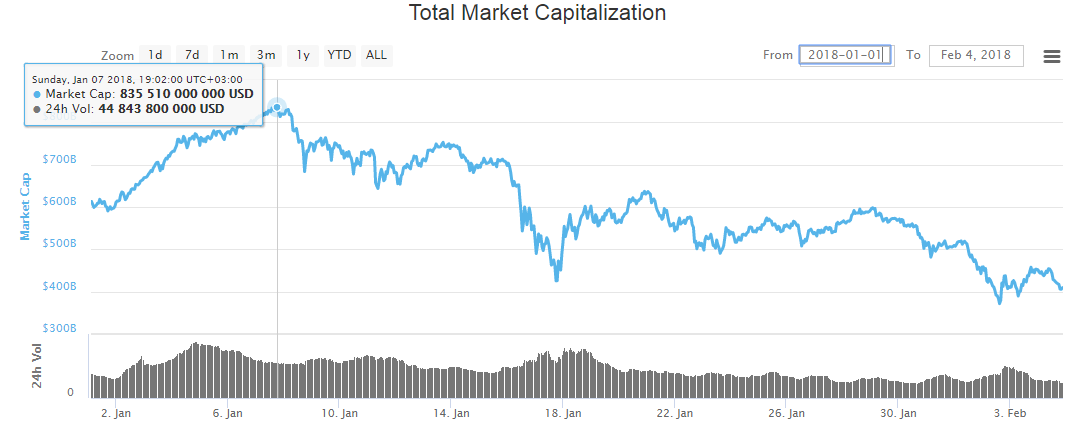
Data source: coinmarketcap.com
Capitalization is showing a downward trend for the fourth week in a row, with the Smith + Crown Index, in turn, dropping to 22,262. The dominance of the four and eight largest cryptocurrencies as of February 4, 2018, (00:00 UTC) equaled 68.4% and 76.4%, respectively, with bitcoin dominance falling to 34.6% (see Table 1.1).
Last week (January 29-February 4, 2018) cryptocurrency market capitalization decreased steadily from $600 billion to $350-$450 billion, which led to a depreciation in the prices of nearly all the coins and tokens in the top 100 cryptocurrencies in terms of capitalization except Revain, DigixDAO, Pillar, and Tether (see fig. 3).
The growth and fall of cryptocurrency prices over the past week (January 29-February 4, 2018)
The prices of some cryptocurrencies may fluctuate from -50% to +50% over the course of a single day. Therefore, when performing an analysis of cryptocurrency price trends, it is advisable to use their average daily amounts on various cryptoexchanges.
Below we consider the top 10 cryptocurrencies that showed the largest drop or gain in price over the past week (fig. 2-3). In this regard, only those coins and tokens included in the top 100 in terms of capitalization (according to the data of coinmarketcap.com) were considered.
Figure 2. Largest fall in prices over the past week
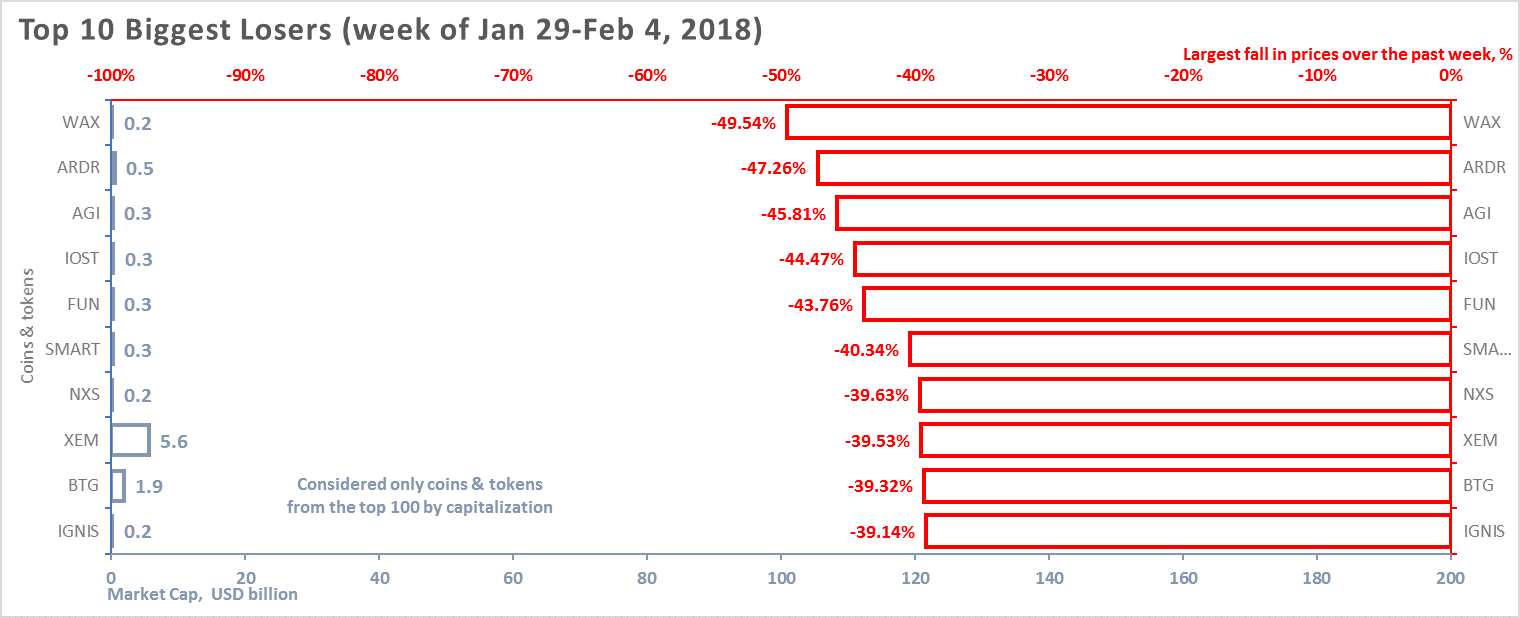
Data source: coinmarketcap.com
The change in price was calculated based on average daily data.
Tables 1.2 and 1.3 show the possible factors or events that could have influenced the fluctuation in prices for certain cryptocurrencies. Table 1.4 shows the possible factors or events that could have influenced the cryptocurrency market in general.
The fall in the prices of most cryptocurrencies over the past week by 10-15% is perfectly understandable and is connected with overall trends on the cryptocurrency market.
Table 1.2. Factors and events that could have led to a fall in cryptocurrency prices over the past week
| № | Coins and tokens | Symbol | Fall in price over the week, % | Average price in $ on Feb 4, 2018 | Market capitalization, USD billion | Factors and events that could have led to a fall in cryptocurrency prices over the past week |
| 1 | WAX | WAX | -49.54% | 0.3981 | 0.2 | The negative trend that started in the second week of January after several sharp ascents in December continued for the entire market this week. Total cryptocurrency market capitalization fell below $400 billion at the end of February 4 (https://coinmarketcap.com/charts/). The cryptocurrency market first reached capitalization of $400 billion in early December 2017, after an extended period of growth. One of the main reasons for the slide of the entire cryptocurrency market is the fall in the bitcoin price, which determines the direction of the market and sets the trend for all the altcoins. The downward adjustment of the market continued this week, with nearly all major tokens and cryptocurrencies depreciating by 25-50%. Therefore, we see the top 10 biggest losers among the 100 largest cryptocurrencies and tokens, starting with WAX which lost 50%, and ending with Ignis which lost 39%. |
| 2 | Ardor | ARDR | -47.26% | 0.5299 | 0.5 | |
| 3 | SingularityNET | AGI | -45.81% | 0.5565 | 0.3 | |
| 4 | IOStoken | IOST | -44.47% | 0.0472 | 0.3 | |
| 5 | FunFair | FUN | -43.76% | 0.0581 | 0.3 | |
| 6 | SmartCash | SMART | -40.34% | 0.3678 | 0.3 | |
| 7 | Nexus | NXS | -39.63% | 3.78 | 0.2 | |
| 8 | NEM | XEM | -39.53% | 0.6273 | 5.6 | |
| 9 | Bitcoin Gold | BTG | -39.32% | 115.48 | 1.9 | |
| 10 | Ignis | IGNIS | -39.14% | 0.2773 | 0.2 |
Last week only three coins & tokens from the top 100 cryptocurrencies by capitalization (not counting Tether) showed price growth (fig. 3, Table 1.3).
Figure 3. Largest growth in prices over the last week
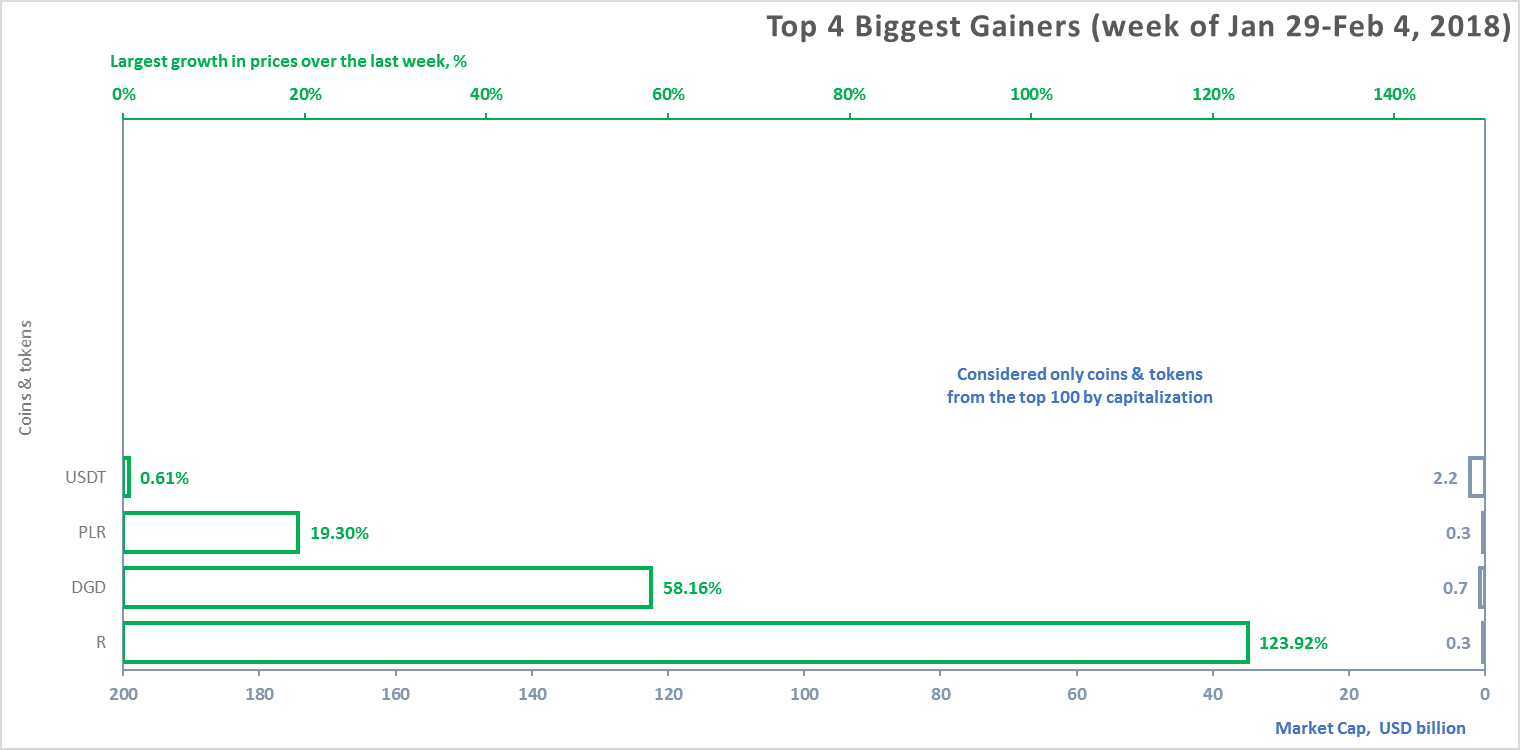
Table 1.3. Factors and events that could have led to a growth in cryptocurrency prices over the past week
| № | Coins and tokens | Symbol | Growth in price over the week, % | Average price in $ on Feb 4, 2018 | Market capitalization, USD billion | Factors and events that could have led to a growth in cryptocurrency prices over the past week |
| 1 | Revain | R | 123.92% | 1.58 | 0.3 | Despite the pronounced negative trend of the entire market this week, there were several tokens that increased in value.
The Revain token managed to grow by a record 120% over the week during an overall market slide, probably due to the large amount of activity on its official page in Twitter, where several favorable news items were published on January 30, including on the update of the platform. However, it is also possible that this was the result of pumping of the token, as a day later the price fell by more than 40% from its peak on January 31. The DigixDao token also experienced a decent upswing on the news on its update. However, by the end of the week of February 4 it had begun to rapidly slip from the price gained, and a further drop to its level at the start of the week is possible. |
|
2 |
Digix
DAO |
DGD | 58.16% | 369.47 | 0.7 | |
| 3 | Pillar | PLR | 19.30% | 1.37 | 0.3 | The Pillar token announced its new partnership on its Twitter account, which triggered growth. However, closer to the end of the week this growth was replaced with a fall |
| 4 | Tether | USDT | 0.61% | 1.00 | 2.2 | Tether was only in the list of tokens whose price did not fall due to its minimal volatility. As is well known, the price of this token is pegged to the US dollar, and cannot change drastically. |
Over the past week, the number of cryptocurrencies with a capitalization of more than $1 billion dropped from 36 to 26, and none of them increased in price based on the results for the week.
Table 1.4 shows events that took place from January 29-February 4, 2018, and had an impact on both the prices of the dominant cryptocurrencies and the market in general, with an indication of their nature and type of impact.
Table 1.4. Key events of the week having an influence on cryptocurrency prices, January 29-February 4, 2018
| № | Factors and events
(link to source) |
Date of news | Date of event* | Description | Nature of impact | Type of impact |
| 1. | S. Korea Starts Real-Name Trading System for Cryptocurrencies [source: Yonhapnews.co.kr] | January 30, 2018 | January 30, 2018 | On January 30, South Korea launched a new system for control over the real names of traders, who can no longer anonymously open bank accounts intended for trading in cryptocurrencies. Some market participants may be against the disclosure of their details and prefer to leave the market. Foreigners and underage backers are prohibited from opening cryptocurrency accounts in South Korea. The new system raises additional difficulties, especially for small cryptoexchanges, since “The new system also requires cryptocurrency exchanges to share users’ transaction data with banks, a move that could potentially allow the government to impose taxes down the line.” | Market ⇓
|
Unfavorable |
| 2. | U.S. Regulators Subpoena Crypto Exchange Bitfinex, Tether [source: Bloomberg] | January 30, 2018 | January 30, 2018 | Tether and Bitfinex will have to prove that they have a reserve of $2.3 billion to secure each Tether coin. This is bad news for the entire crypto industry, since it threatens the major exchange Bitfinex, the trade turnover of which reaches a billion US dollars a day. If it turns out that Tether has a problem with reserves, this could cause a new downturn in the crypto industry. | Market ⇓
|
Unfavorable |
| 3. | Facebook is Banning All Ads Promoting Сryptocurrencies and ICOs [source: Coinspeaker] | January 31, 2018 | January 31, 2018 | Facebook has banned all ads related to the crypto industry, including ICOs, bitcoin and Ethereum. This is bad news for the market, since it makes it clear that many are still wary of cryptocurrencies and associate their use with big risks. | Market ⇓ | Unfavorable |
* Event already took place
To analyze trading activity on cryptocurrency exchanges, the ZAK-n Crypto index is calculated (see the Glossary). The values of the ZAK-4 Crypto and ZAK-8 Crypto indices are presented in Tables 1.1, 1.5.a, and 1.5.b. For example, on January 2, 2018, the 24-hour trading volume (Volume 24h) for the four dominant cryptocurrencies (Bitcoin, Ethereum, Bitcoin Cash, and Ripple) exceeded $40 billion (Table 1.5.a).
The value of the ZAK-4 Crypto equaled 8.1%, which attests to the extremely high liquidity and market dynamism of the dominant cryptocurrencies. By the start of the downturn on the cryptocurrency market (January 17, 2018 and February 2, 2018) the value of the index had reached 9.7% and 7.6%, respectively, i.e. the daily turnover of cryptocurrencies equaled nearly 10% of total market capitalization.
Table 1.5.a. Daily ZAK-4 Crypto index calculation (from January 1, 2018, to February 4, 2018)
| Crypto | Bitcoin (BTC) | Ethereum (ETH) | Bitcoin Cash (BCH) | Ripple (XRP) | 4 Crypto | ||||||||||
| Price Open | Volume (24h) | Market cap | Price Open | Volume (24h) | Market cap | Price Open | Volume (24h) | Market cap | Price Open | Volume (24h) | Market cap | Volume (24h) 4 crypto | Market cap 4 crypto | ZAK-4 Crypto index | |
| Date | $ | USD billion | USD billion | $ | USD billion | USD billion | $ | USD billion | USD billion | $ | USD billion | USD billion | USD billion | USD billion | % |
| Feb 4, 2018 | 9 176 | 7.1 | 154.6 | 965 | 3.0 | 94.0 | 1 273 | 0.7 | 21.6 | 0.91 | 1.2 | 35.6 | 11.9 | 305.7 | 3.9% |
| Feb 3, 2018 | 8 852 | 7.3 | 149.1 | 919 | 3.2 | 89.5 | 1 194 | 0.5 | 20.2 | 0.89 | 2.0 | 34.8 | 12.9 | 293.6 | 4.4% |
| Feb 2, 2018 | 9 142 | 12.7 | 154.0 | 1 036 | 6.7 | 100.8 | 1 273 | 0.9 | 21.6 | 0.96 | 3.5 | 37.5 | 23.9 | 313.8 | 7.6% |
| Feb 1, 2018 | 10 237 | 10.0 | 172.4 | 1 119 | 5.3 | 109.0 | 1 491 | 0.7 | 25.3 | 1.16 | 1.4 | 45.0 | 17.3 | 351.6 | 4.9% |
| Jan 31, 2018 | 10 108 | 8.0 | 170.2 | 1 071 | 3.8 | 104.2 | 1 471 | 0.7 | 24.9 | 1.13 | 1.3 | 43.8 | 13.8 | 343.1 | 4.0% |
| Jan 30, 2018 | 11 307 | 8.6 | 190.3 | 1 184 | 4.1 | 115.2 | 1 658 | 0.6 | 28.1 | 1.33 | 1.1 | 51.5 | 14.5 | 385.1 | 3.8% |
| Jan 29, 2018 | 11 756 | 7.1 | 197.9 | 1 247 | 3.7 | 121.3 | 1 745 | 0.4 | 29.6 | 1.40 | 1.1 | 54.2 | 12.3 | 402.9 | 3.0% |
| Jan 28, 2018 | 11 475 | 8.4 | 193.1 | 1 112 | 5.4 | 108.1 | 1 636 | 0.6 | 27.7 | 1.22 | 1.3 | 47.4 | 15.6 | 376.4 | 4.2% |
| Jan 27, 2018 | 11 175 | 7.6 | 188.1 | 1 056 | 3.0 | 102.7 | 1 603 | 0.4 | 27.1 | 1.22 | 0.7 | 47.2 | 11.7 | 365.0 | 3.2% |
| Jan 26, 2018 | 11 256 | 9.7 | 189.4 | 1 053 | 3.6 | 102.3 | 1 637 | 0.6 | 27.7 | 1.31 | 2.0 | 50.7 | 16.0 | 370.2 | 4.3% |
| Jan 25, 2018 | 11 422 | 8.9 | 192.2 | 1 063 | 4.1 | 103.3 | 1 661 | 0.5 | 28.1 | 1.36 | 1.0 | 52.8 | 14.4 | 376.4 | 3.8% |
| Jan 24, 2018 | 10 903 | 9.9 | 183.4 | 987 | 3.9 | 96.0 | 1 622 | 0.5 | 27.5 | 1.35 | 1.9 | 52.4 | 16.2 | 359.2 | 4.5% |
| Jan 23, 2018 | 10 945 | 9.7 | 184.1 | 1 004 | 3.6 | 97.6 | 1 623 | 0.6 | 27.5 | 1.35 | 3.0 | 52.4 | 16.8 | 361.5 | 4.6% |
| Jan 22, 2018 | 11 633 | 10.5 | 195.6 | 1 055 | 3.8 | 102.5 | 1 794 | 0.7 | 30.4 | 1.39 | 2.6 | 53.9 | 17.7 | 382.4 | 4.6% |
| Jan 21, 2018 | 12 889 | 9.9 | 216.7 | 1 156 | 3.4 | 112.2 | 2 034 | 0.7 | 34.4 | 1.58 | 2.8 | 61.1 | 16.9 | 424.4 | 4.0% |
| Jan 20, 2018 | 11 656 | 11.8 | 196.0 | 1 045 | 4.0 | 101.5 | 1 784 | 1.1 | 30.2 | 1.56 | 2.3 | 60.5 | 19.2 | 388.2 | 5.0% |
| Jan 19, 2018 | 11 430 | 10.7 | 192.2 | 1 029 | 4.1 | 99.9 | 1 740 | 0.7 | 29.4 | 1.58 | 3.7 | 61.3 | 19.3 | 382.7 | 5.0% |
| Jan 18, 2018 | 11 199 | 15.0 | 188.2 | 1 016 | 5.9 | 98.6 | 1 752 | 1.0 | 29.6 | 1.31 | 9.1 | 50.6 | 31.1 | 367.1 | 8.5% |
| Jan 17, 2018 | 11 431 | 18.8 | 192.1 | 1 061 | 8.5 | 103.0 | 1 768 | 1.5 | 29.9 | 1.18 | 7.3 | 45.9 | 36.1 | 370.9 | 9.7% |
| Jan 16, 2018 | 13 836 | 18.9 | 232.5 | 1 293 | 8.4 | 125.4 | 2 407 | 1.7 | 40.7 | 1.68 | 5.7 | 65.0 | 34.7 | 463.6 | 7.5% |
| Jan 15, 2018 | 13 767 | 12.8 | 231.3 | 1 365 | 4.8 | 132.4 | 2 542 | 1.4 | 43.0 | 1.86 | 1.8 | 71.9 | 20.8 | 478.6 | 4.3% |
| Jan 14, 2018 | 14 371 | 11.1 | 241.4 | 1 397 | 4.8 | 135.5 | 2 687 | 1.0 | 45.4 | 2.02 | 2.0 | 78.2 | 18.9 | 500.6 | 3.8% |
| Jan 13, 2018 | 13 952 | 12.8 | 234.4 | 1 270 | 5.7 | 123.2 | 2 618 | 1.2 | 44.3 | 2.05 | 2.1 | 79.5 | 21.9 | 481.3 | 4.5% |
| Jan 12, 2018 | 13 454 | 12.1 | 226.0 | 1 158 | 5.2 | 112.3 | 2 476 | 1.1 | 41.9 | 1.94 | 3.3 | 75.2 | 21.7 | 455.3 | 4.8% |
| Jan 11, 2018 | 14 968 | 16.5 | 251.4 | 1 268 | 7.2 | 122.9 | 2 892 | 1.9 | 48.9 | 1.98 | 6.3 | 76.7 | 32.0 | 499.9 | 6.4% |
| Jan 10, 2018 | 14 589 | 18.5 | 245.0 | 1 300 | 9.2 | 126.0 | 2 390 | 2.6 | 40.4 | 2.13 | 4.8 | 82.5 | 35.1 | 493.9 | 7.1% |
| Jan 9, 2018 | 15 124 | 16.7 | 253.9 | 1 146 | 8.0 | 111.0 | 2 412 | 1.1 | 40.8 | 2.44 | 3.7 | 94.7 | 29.4 | 500.4 | 5.9% |
| Jan 8, 2018 | 16 476 | 18.4 | 276.6 | 1 158 | 8.5 | 112.2 | 2 787 | 1.4 | 47.1 | 3.36 | 3.3 | 130.3 | 31.6 | 566.2 | 5.6% |
| Jan 7, 2018 | 17 527 | 15.9 | 294.2 | 1 043 | 5.6 | 101.0 | 2 785 | 1.4 | 47.1 | 3.09 | 2.4 | 119.8 | 25.3 | 562.1 | 4.5% |
| Jan 6, 2018 | 17 462 | 18.3 | 293.1 | 995 | 4.7 | 96.3 | 2 584 | 1.7 | 43.7 | 3.02 | 2.8 | 117.0 | 27.4 | 550.1 | 5.0% |
| Jan 5, 2018 | 15 477 | 23.8 | 259.7 | 976 | 6.7 | 94.4 | 2 401 | 2.1 | 40.6 | 3.30 | 6.3 | 127.9 | 38.9 | 522.6 | 7.4% |
| Jan 4, 2018 | 15 271 | 21.8 | 256.3 | 962 | 6.5 | 93.0 | 2 609 | 5.4 | 44.1 | 3.12 | 8.1 | 120.8 | 41.8 | 514.1 | 8.1% |
| Jan 3, 2018 | 14 978 | 16.9 | 251.3 | 886 | 5.1 | 85.7 | 2 701 | 4.7 | 45.6 | 2.46 | 6.6 | 95.5 | 33.3 | 478.1 | 7.0% |
| Jan 2, 2018 | 13 625 | 16.8 | 228.6 | 772 | 5.8 | 74.7 | 2 435 | 1.8 | 41.1 | 2.37 | 3.2 | 91.8 | 27.6 | 436.2 | 6.3% |
| Jan 1, 2018 | 14 112 | 10.3 | 236.7 | 756 | 2.6 | 73.1 | 2 535 | 0.9 | 42.8 | 2.30 | 1.9 | 88.9 | 15.7 | 441.6 | 3.6% |
* Data as of February 4, 2018, 00:00 UTC
** Data source: coinmarketcap.com
The 24-hour trading volumes (Volume 24h) for the eight dominant cryptocurrencies (Bitcoin, Ethereum, Bitcoin Cash, Ripple, Litecoin, Stellar, NEO, and Cardano) equaled $14.2 billion at the end of last week (Table 1.5.b), i.e. 4.1% of their market capitalization. The ZAK-4 Crypto and ZAK-8 Crypto indices are considered in more detail in Tables 1.5.a and 1.5.b.
Table 1.5.b. Daily ZAK-8 Crypto index calculation (continuation of Table 1.5.а)
| Crypto | Stellar (XLM) | Cardano (ADA) | NEO (NEO) | Litecoin (LTC) | 8 Crypto | ||||||||||
| Price Open | Volume (24h) | Market cap | Price Open | Volume (24h) | Market cap | Price Open | Volume (24h) | Market cap | Price Open | Volume (24h) | Market cap | Volume (24h) | Market cap | ZAK-8 Crypto index | |
| Date | $ | USD billion | USD billion | $ | USD billion | USD billion | $ | USD billion | USD billion | $ | USD billion | USD billion | USD billion | USD billion | % |
| Feb 4, 2018 | 0.43 | 0.23 | 7.9 | 0.434 | 0.8 | 11.2 | 122.2 | 0.20 | 7.9 | 160 | 1.0 | 8.8 | 14.2 | 341.6 | 4.1% |
| Feb 3, 2018 | 0.41 | 0.28 | 7.5 | 0.401 | 1.4 | 10.4 | 121.0 | 0.26 | 7.9 | 131 | 0.7 | 7.2 | 15.6 | 326.6 | 4.8% |
| Feb 2, 2018 | 0.46 | 0.40 | 8.4 | 0.419 | 1.4 | 10.9 | 125.6 | 0.55 | 8.2 | 143 | 0.8 | 7.8 | 27.1 | 349.1 | 7.8% |
| Feb 1, 2018 | 0.54 | 0.17 | 10.0 | 0.516 | 0.6 | 13.4 | 146.0 | 0.36 | 9.5 | 164 | 0.5 | 9.0 | 19.0 | 393.4 | 4.8% |
| Jan 31, 2018 | 0.49 | 0.29 | 8.7 | 0.528 | 0.5 | 13.7 | 145.4 | 0.36 | 9.5 | 165 | 0.4 | 9.1 | 15.3 | 384.1 | 4.0% |
| Jan 30, 2018 | 0.59 | 0.18 | 10.6 | 0.625 | 0.4 | 16.2 | 168.9 | 0.67 | 11.0 | 181 | 0.4 | 10.0 | 16.2 | 432.8 | 3.7% |
| Jan 29, 2018 | 0.63 | 0.12 | 11.3 | 0.669 | 0.2 | 17.4 | 152.1 | 0.60 | 9.9 | 194 | 0.3 | 10.6 | 13.5 | 452.1 | 3.0% |
| Jan 28, 2018 | 0.62 | 0.19 | 11.0 | 0.621 | 0.3 | 16.1 | 140.4 | 0.25 | 9.1 | 181 | 0.4 | 10.0 | 16.8 | 422.6 | 4.0% |
| Jan 27, 2018 | 0.63 | 0.22 | 11.3 | 0.623 | 0.3 | 16.2 | 138.1 | 0.21 | 9.0 | 177 | 0.3 | 9.7 | 12.8 | 411.2 | 3.1% |
| Jan 26, 2018 | 0.60 | 0.79 | 10.8 | 0.634 | 0.8 | 16.4 | 137.8 | 0.32 | 9.0 | 180 | 0.4 | 9.9 | 18.3 | 416.2 | 4.4% |
| Jan 25, 2018 | 0.57 | 0.63 | 10.1 | 0.629 | 0.7 | 16.3 | 138.1 | 0.32 | 9.0 | 182 | 0.4 | 10.0 | 16.4 | 421.8 | 3.9% |
| Jan 24, 2018 | 0.49 | 0.67 | 8.7 | 0.563 | 0.7 | 14.6 | 122.6 | 0.43 | 8.0 | 178 | 0.4 | 9.8 | 18.4 | 400.3 | 4.6% |
| Jan 23, 2018 | 0.48 | 0.21 | 8.5 | 0.567 | 0.4 | 14.7 | 123.4 | 0.26 | 8.0 | 180 | 0.4 | 9.9 | 18.1 | 402.6 | 4.5% |
| Jan 22, 2018 | 0.47 | 0.44 | 8.3 | 0.615 | 0.5 | 15.9 | 132.3 | 0.35 | 8.6 | 192 | 0.5 | 10.5 | 19.5 | 425.8 | 4.6% |
| Jan 21, 2018 | 0.53 | 0.16 | 9.6 | 0.710 | 0.8 | 18.3 | 150.2 | 0.35 | 9.8 | 211 | 0.5 | 11.6 | 18.7 | 473.7 | 4.0% |
| Jan 20, 2018 | 0.51 | 0.20 | 9.1 | 0.660 | 0.7 | 17.0 | 140.5 | 0.50 | 9.1 | 194 | 0.5 | 10.7 | 21.2 | 434.1 | 4.9% |
| Jan 19, 2018 | 0.50 | 0.21 | 9.0 | 0.650 | 0.6 | 16.8 | 141.3 | 0.49 | 9.2 | 191 | 0.6 | 10.5 | 21.1 | 428.3 | 4.9% |
| Jan 18, 2018 | 0.48 | 0.47 | 8.6 | 0.630 | 1.3 | 16.4 | 142.6 | 0.84 | 9.3 | 187 | 0.9 | 10.2 | 34.6 | 411.6 | 8.4% |
| Jan 17, 2018 | 0.44 | 0.49 | 7.9 | 0.620 | 1.7 | 16.2 | 144.7 | 1.59 | 9.4 | 190 | 1.4 | 10.4 | 41.3 | 414.8 | 10.0% |
| Jan 16, 2018 | 0.60 | 0.47 | 10.7 | 0.780 | 1.6 | 20.2 | 188.0 | 1.66 | 12.2 | 233 | 1.4 | 12.8 | 39.8 | 519.6 | 7.7% |
| Jan 15, 2018 | 0.63 | 0.35 | 11.2 | 0.800 | 1.0 | 20.6 | 170.1 | 1.46 | 11.1 | 237 | 0.6 | 13.0 | 24.2 | 534.5 | 4.5% |
| Jan 14, 2018 | 0.67 | 0.12 | 12.0 | 0.882 | 0.2 | 22.9 | 140.6 | 0.65 | 9.1 | 261 | 0.9 | 14.3 | 20.7 | 558.9 | 3.7% |
| Jan 13, 2018 | 0.68 | 0.19 | 12.2 | 0.917 | 0.3 | 23.8 | 124.2 | 0.46 | 8.1 | 237 | 1.0 | 13.0 | 23.8 | 538.3 | 4.4% |
| Jan 12, 2018 | 0.56 | 0.39 | 10.0 | 0.696 | 0.4 | 18.0 | 109.2 | 0.23 | 7.1 | 230 | 0.7 | 12.6 | 23.4 | 503.0 | 4.7% |
| Jan 11, 2018 | 0.56 | 0.33 | 10.1 | 0.792 | 0.2 | 20.5 | 123.1 | 0.27 | 8.0 | 252 | 1.1 | 13.8 | 33.9 | 552.2 | 6.1% |
| Jan 10, 2018 | 0.59 | 0.25 | 10.5 | 0.816 | 0.2 | 21.2 | 127.2 | 0.36 | 8.3 | 248 | 1.0 | 13.6 | 37.0 | 547.4 | 6.8% |
| Jan 9, 2018 | 0.63 | 0.21 | 11.2 | 0.898 | 0.2 | 23.3 | 102.1 | 0.53 | 6.6 | 255 | 0.9 | 13.9 | 31.3 | 555.4 | 5.6% |
| Jan 8, 2018 | 0.70 | 0.25 | 12.4 | 0.999 | 0.3 | 25.9 | 102.1 | 0.23 | 6.6 | 288 | 1.2 | 15.7 | 33.5 | 626.9 | 5.3% |
| Jan 7, 2018 | 0.71 | 0.35 | 12.7 | 1.020 | 0.2 | 26.6 | 101.1 | 0.20 | 6.6 | 296 | 1.1 | 16.2 | 27.1 | 624.1 | 4.3% |
| Jan 6, 2018 | 0.66 | 0.44 | 11.9 | 0.997 | 0.3 | 25.8 | 95.3 | 0.19 | 6.2 | 250 | 2.3 | 13.6 | 30.6 | 607.6 | 5.0% |
| Jan 5, 2018 | 0.74 | 0.73 | 13.2 | 1.170 | 0.5 | 30.4 | 98.9 | 0.29 | 6.4 | 241 | 1.7 | 13.2 | 42.2 | 585.8 | 7.2% |
| Jan 4, 2018 | 0.89 | 0.89 | 16.0 | 1.090 | 0.6 | 28.4 | 104.8 | 0.33 | 6.8 | 245 | 3.5 | 13.4 | 47.1 | 578.7 | 8.1% |
| Jan 3, 2018 | 0.56 | 1.51 | 10.1 | 0.780 | 0.7 | 20.2 | 90.3 | 0.29 | 5.9 | 256 | 3.2 | 14.0 | 39.0 | 528.2 | 7.4% |
| Jan 2, 2018 | 0.50 | 0.68 | 8.9 | 0.725 | 0.3 | 18.8 | 78.5 | 0.37 | 5.1 | 229 | 1.2 | 12.5 | 30.2 | 481.4 | 6.3% |
| Jan 1, 2018 | 0.36 | 0.67 | 6.4 | 0.719 | 0.2 | 18.6 | 76.2 | 0.14 | 5.0 | 232 | 0.6 | 12.6 | 17.3 | 484.2 | 3.6% |
In general, there was a fairly considerable discrepancy in price changes during January (January 1-31, 2018) from -50% to +92%, even among the leaders in terms of capitalization (fig. 4). It is clear that owners have rearranged their preferences in the search for the optimal portfolio.
Figure 4. Change in the prices among the Top 10 cryptocurrencies in terms of capitalization during January 2018, %
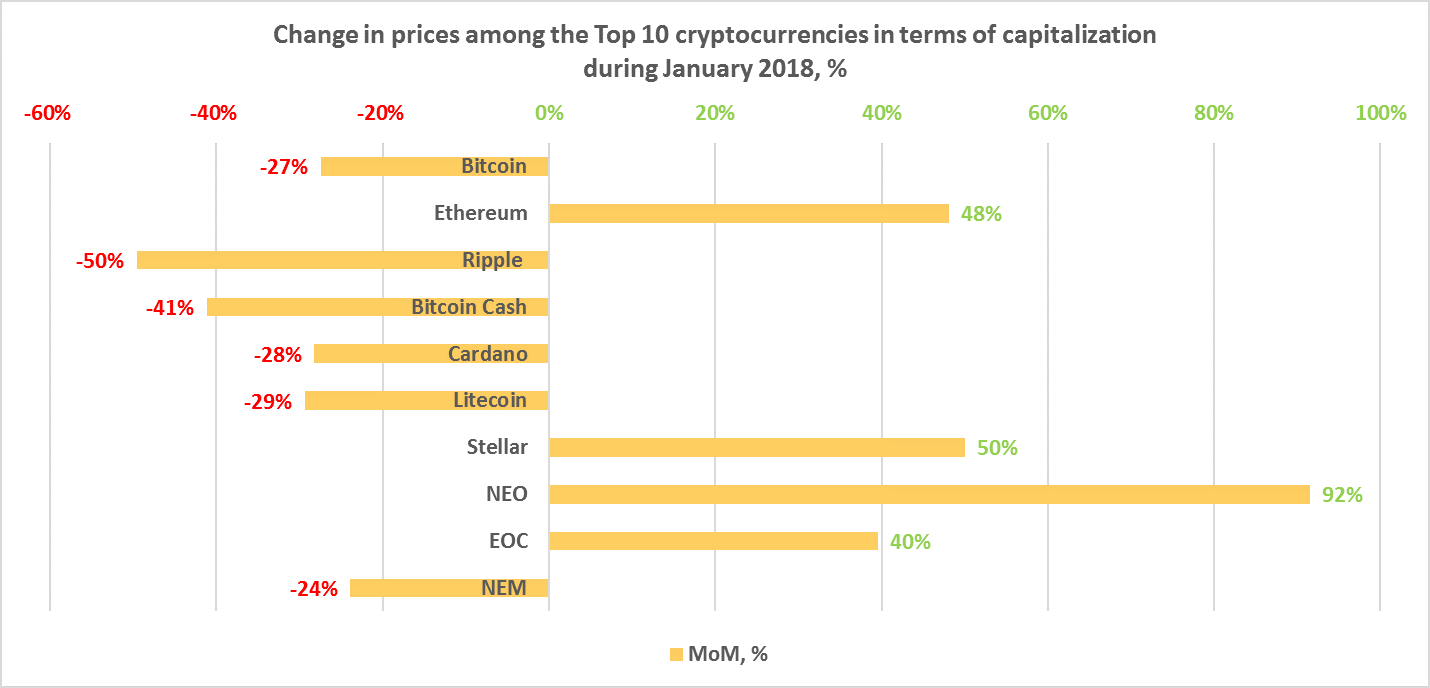
After the extended growth of the entire cryptocurrency market throughout 2017, most coins and tokens have experienced a major adjustment in January and early February. The prices of the majority of the most popular coins and tokens fell considerably, to the level of early December.
Many predicted this adjustment, as it happens after each jump in the market. Movements in the Bitcoin price are usually the signal for market participants, with an average downward adjustment of 30-50% taking place after sharp increases, which drags all the altcoins with it. This theory is supported by the graphs from (https://coinmarketcap.com/), which show that cryptocurrencies and tokens experienced rapid growth over the course of several months starting in November, with market capitalization increasing from $200 billion in early November to $800 billion in early January. Many analysts forecast a downward adjustment after such a major jump.
The main triggers for the start of the market adjustment were the fall in the bitcoin price against the backdrop of the expiration of futures contracts (under which it was advantageous for major players that the bitcoin price be lower than at the opening of the futures contracts), the unfavorable news from the South Korean markets, where regulation of the crypto industry was tightened, and the full ban on the crypto industry in India.
However, as can be seen from the table above, five cryptocurrencies/tokens (Ethereum, EOS, NEO, Stellar, and EOS) did not experience this significant adjustment. This could be due to the fact that their cycle runs a bit behind the bitcoin cycle. These crypto projects are very close competitors, and their prices correlate strongly with one another, in particular with the leader of the sector Ethereum. All the projects offer the opportunity to launch independent projects on the blockchain. It follows from the graph that ETH is lagging somewhat behind bitcoin, and its rapid growth and fall begin slightly later than bitcoin. The other three projects (Stellar, EOS, and NEO) follow the movement of ETH.
Table 1.6 gives a list of events, information on which appeared last week, which could impact both the prices of specific cryptocurrencies and the market in general.
Table 1.6. Events that could have an influence on cryptocurrency prices in the future
|
№ |
Factors and events
(link to source) |
Date of news | Date of event* | Description | Nature of impact | Type of impact |
| 1. | Coincheck to Repay Hack Victims’ XEM Balances at 81 U.S. Cents Each [source: Bitcoin.com] | January 31, 2018 | n/a | The Coincheck exchange has announced that it is prepared to pay all its clients who were victims of the XEM theft. The exchange is ready to pay $0.81 for each stolen cryptocurrency coin. This announcement increases trust in cryptocurrencies and, in particular, in Coincheck, which could help to soften the negative effect of the news on the major theft. | Market ⇑ | Favorable |
| 2. | India Vows to Eliminate Use of Cryptocurrencies [source: Reuters] | February 1, 2018 | n/a | The stern statement of the Indian Finance Minister regarding the crypto industry as a whole could spark the sudden sale of a large quantity of digital assets and cause a fall in the market. India plans to eliminate the use of all cryptocurrencies. | Market ⇓ | Unfavorable |
| 3. | Japanese Financial Authority Inspecting 32 Cryptocurrency Exchanges [source: Bitcoin.com] | February 3, 2018 | n/a | The inspection of all 32 cryptoexchanges in the country, including 16 cryptoexchanges that have not yet received a license, might unearth new errors and violations in the work of the exchanges and trigger a new wave of unfavorable news items and possibly the closing of several exchanges. However, a more positive scenario in which no serious errors are discovered is also possible. | Market | Uncertain |
* Event will happen in the future (date, year, n/a – not available)
1.2 Market trends
The weekly cryptocurrency and digital asset market trends from October 1, 2017, to February 4, 2018, are presented as graphs (Fig. 1.1-1.5)*.
Table 1.7. Legends and descriptions of the figures
| Global Figures | Figure** | Description |
| Total cryptocurrency market capitalization, USD million | Fig. 1.1 | This figure shows cryptocurrency and digital asset market capitalization trends from October 1, 2017. |
| The rate of market change (as a % to the beginning of 2017) | Fig. 1.1 | This figure shows the % change in cryptocurrency and digital asset market capitalization compared to January 1, 2017. |
| Change in the market capitalization (in USD million compared to previous period) | Fig. 1.2 | This figure shows the weekly change in USD million (increase or decrease) in cryptocurrency and digital asset market capitalization from October 1, 2017. |
| The rate of market change (as a % compared to the previous period) | Fig. 1.2 | This figure shows the % of weekly change (increase or decrease) in cryptocurrency and digital asset market capitalization from October 1, 2017. |
| Number of cryptocurrencies and digital assets | Fig.1.3 | This figure shows the trends in the increase of the number of cryptocurrencies and digital assets circulating on cryptocurrency exchanges. On January 1, 2017, their number was 617, and as of February 4, 2018, this number had already reached 1,482. |
| Average market capitalization, USD million | Fig. 1.3 | This figure reflects the growth in the average cryptocurrency and digital asset market capitalization from October 1, 2017, i.e. the ratio between the market capitalization of all cryptocurrencies and digital assets and their number. |
| Forecast of total cryptocurrency market capitalization | Fig. 1.4, 1.5 | This figure shows the time trend (forecast) change in cryptocurrency and digital asset market capitalization. |
* Data as of February 4, 2018, 00:00 UTC
** The figures below present average data for 24 hours
Data source: coinmarketcap.com
Figure 1.1. Total cryptocurrency market capitalization*
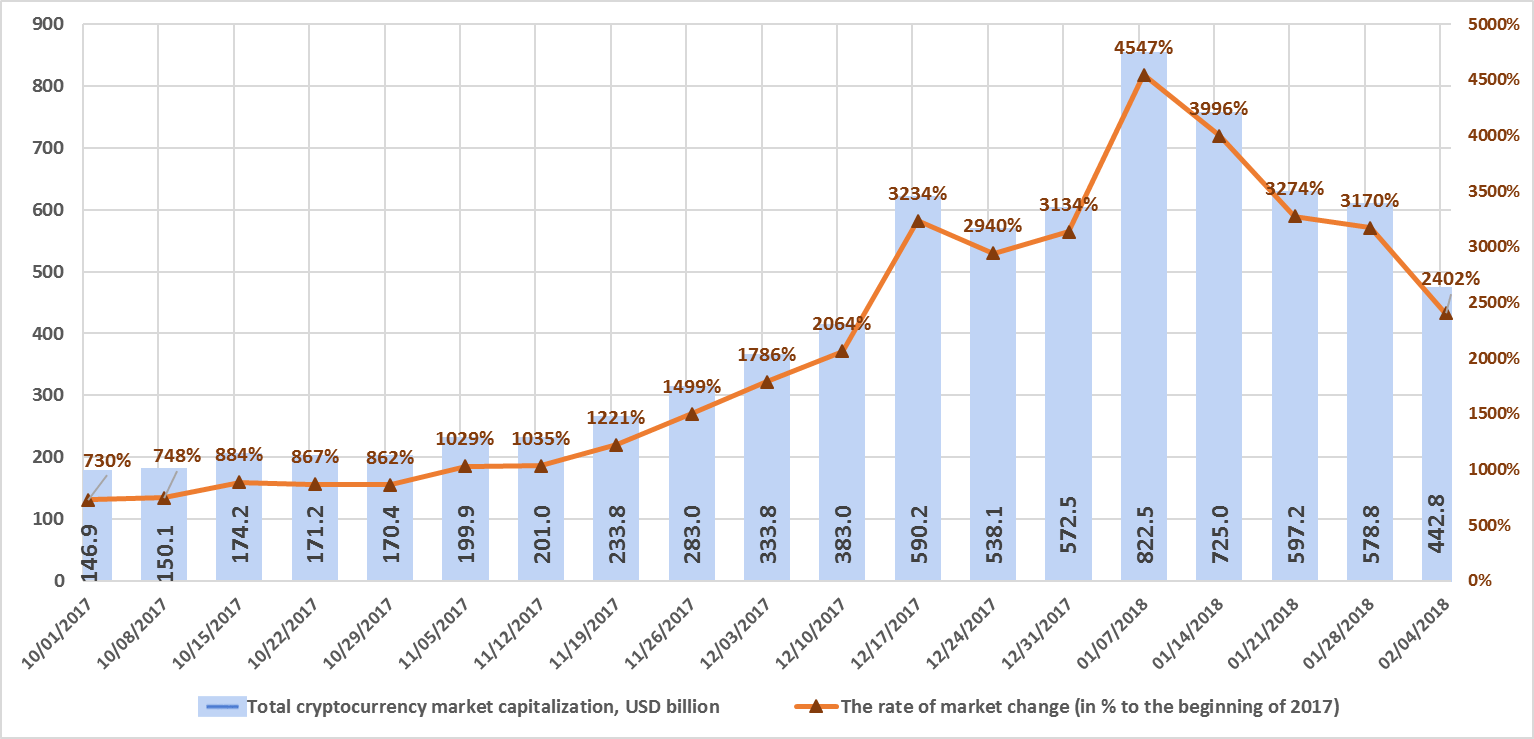
* Average daily data (according to the data of coinmarketcap.com).
Figure 1.1 shows a graph of the weekly cryptocurrency market change from October 1, 2017, to February 4, 2018. Over this period, market capitalization increased from $146.9 billion to $442.8 billion, a growth of 2,402% relative to the start of 2017. Over the first week of January 2018, total market capitalization exceeded $800 billion for the first time, but over the following four weeks (January 8-February 4, 2018) total market capitalization fell from $822.5 billion to $442.8 billion (as of February 4, 2018, based on the average figures from coinmarketcap.com), i.e. it was nearly halved.
Figure 1.2. Change in market capitalization
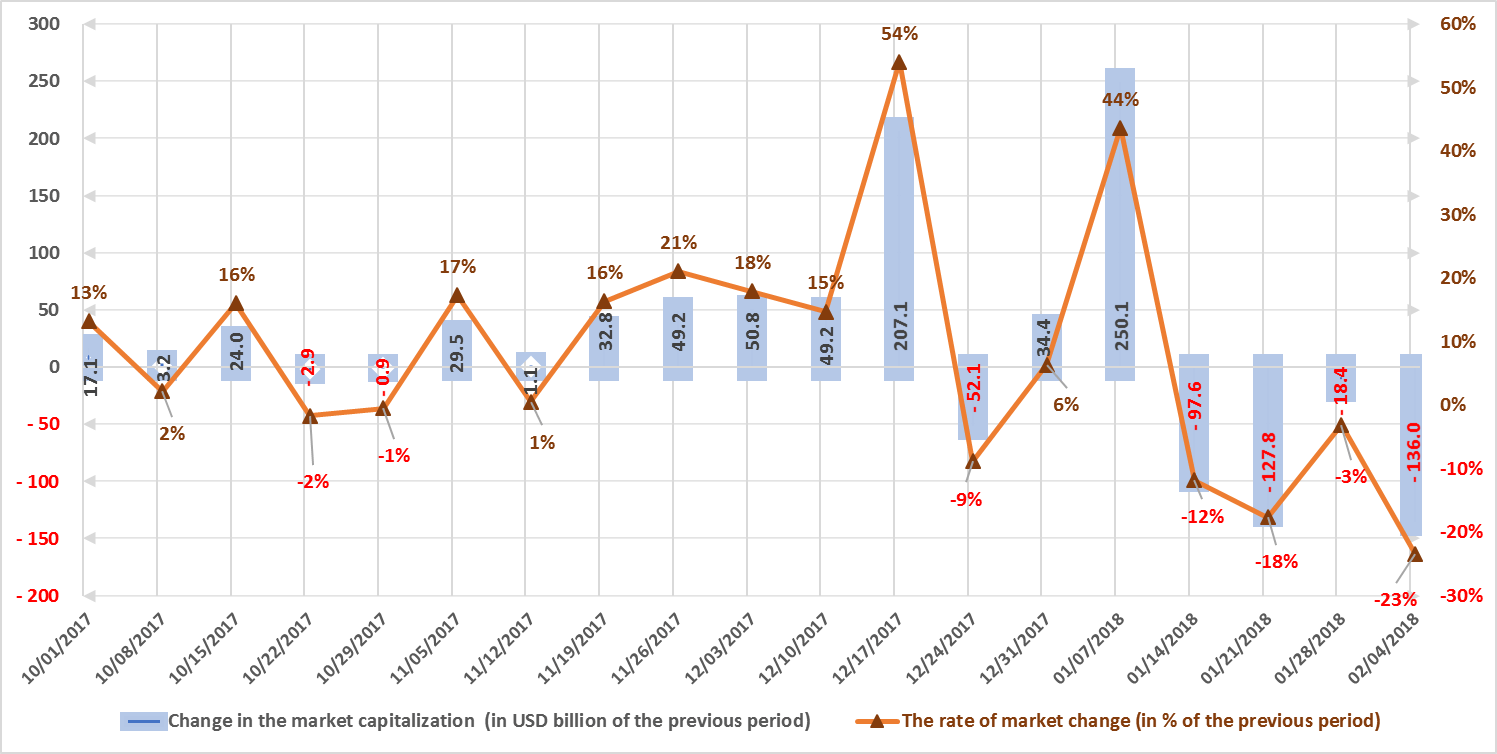
Despite the significant growth in cryptocurrency market capitalization in Q3 2017 and over the entire year, the market is susceptible to sudden and drastic fluctuations. The highest growth rate in Q4 2017 was around $200 billion, or 54%, during the week of December 17-24, 2017. During the first week of January, market capitalization increased by approximately $250 billion, or 44%, but over the following four weeks decreases of approximately $100 billion, $130 billion, $20 billion, and $136 billion, respectively, were seen (with due account of average daily data, see fig. 1.2).
Figure 1.3. Number of cryptocurrencies and digital assets
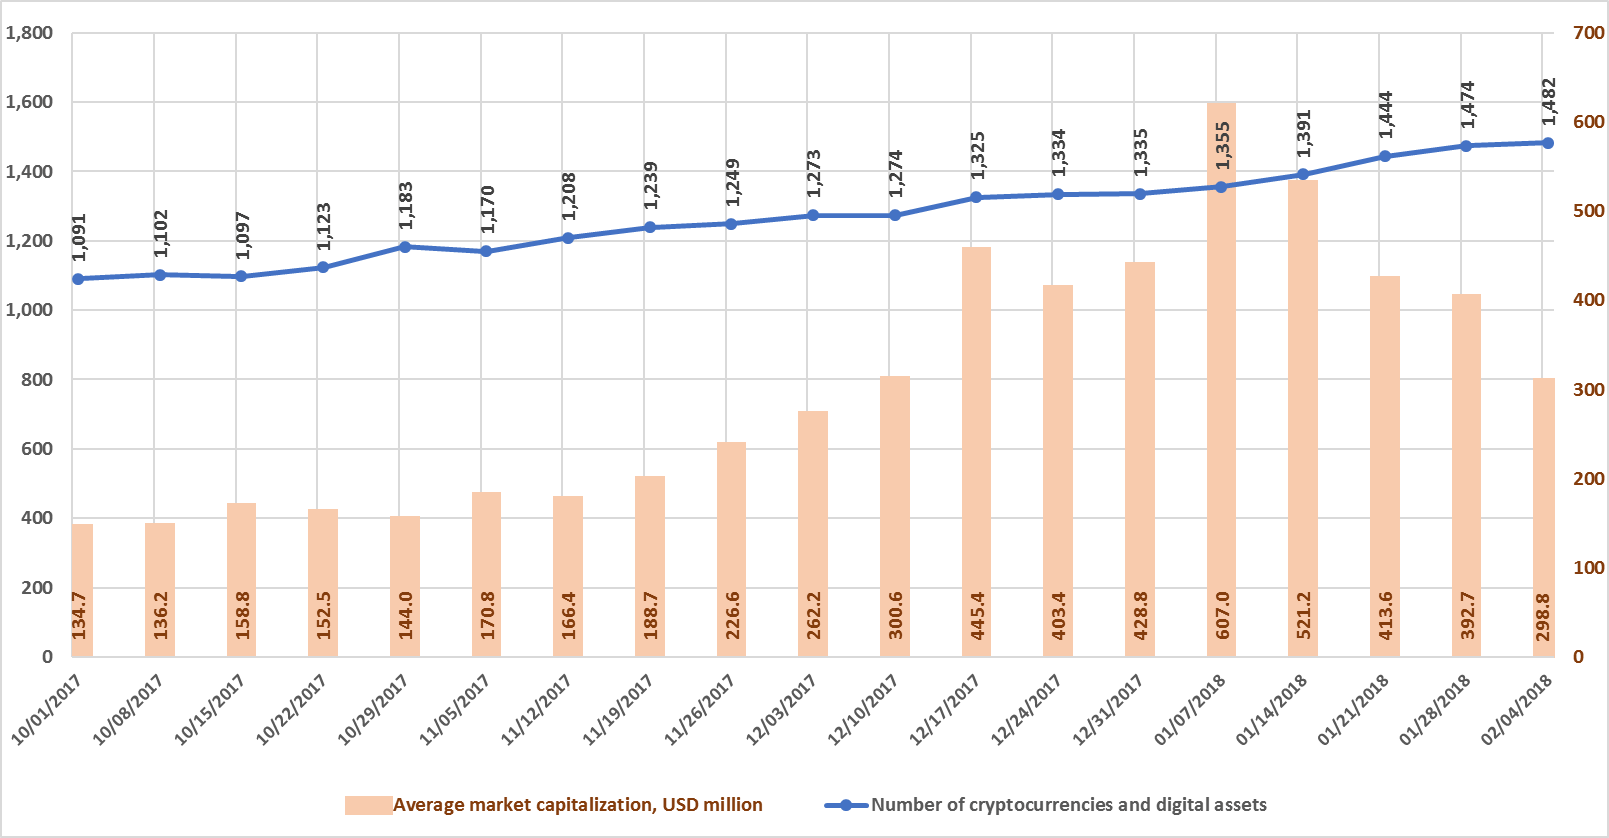
Data source: coinmarketcap.com
The total number of cryptocurrencies and digital assets listed on exchanges has grown since the start of October from 1,091 to 1,482. Their number increased by 8 over the past week alone, from 1,474 to 1,482. In this regard, over the past four weeks average cryptocurrency and digital asset capitalization has decreased from $607 million to $298.8 million.
Figures 1.4 and 1.5. Forecast of total cryptocurrency market capitalization
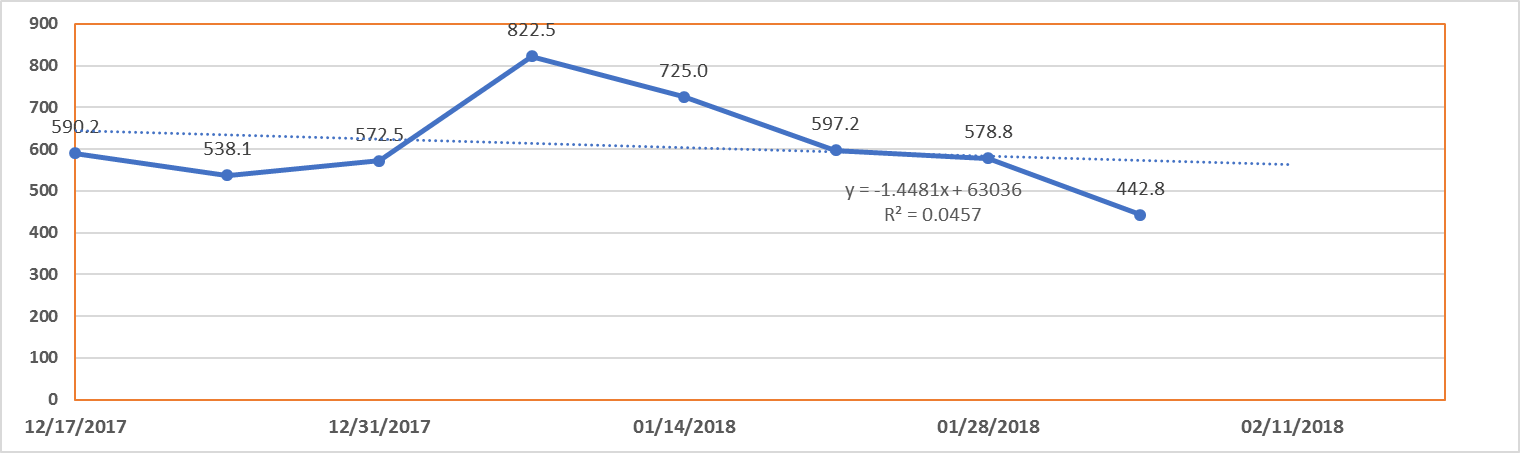
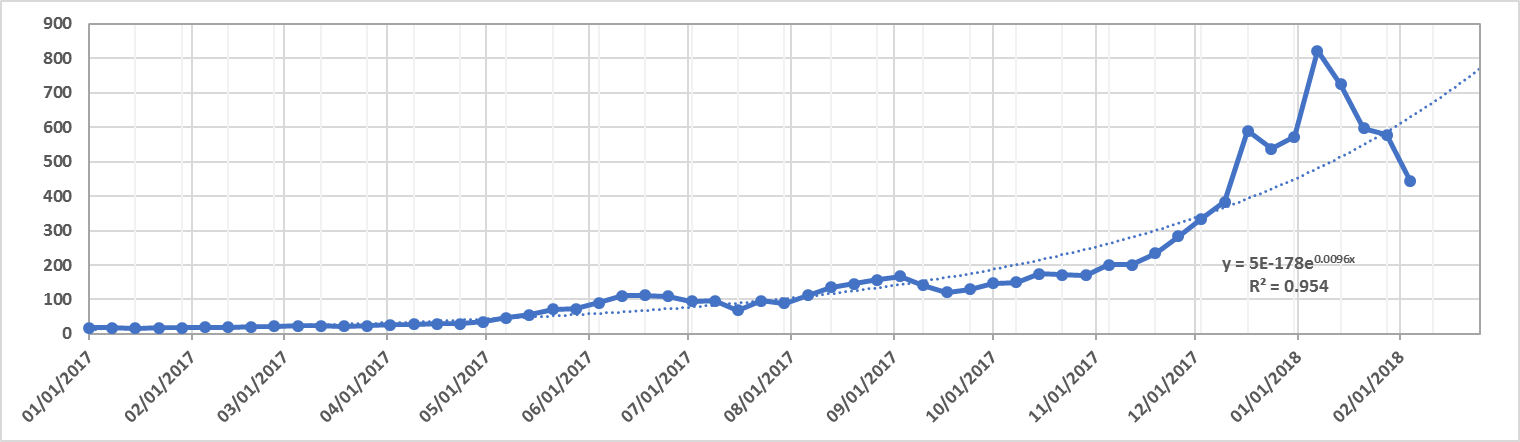
The market has fallen for four weeks in a row. It is fairly difficult to build trend forecasts due to the high sensitivity of the cryptocurrency market to news and the constant events taking place in this technology-intensive and dynamic sector. The market is not limited to the territory of one country, meaning that events taking place throughout the world have an impact on capitalization.
The last month was very eventful. During 2017 the cryptocurrency market attracted the attention of major industrial structures around the globe. As a result, mechanisms related to regulation of the crypto industry appeared in many countries.
Many actions aimed at identification, taxation, centralization, functional limitation, bans, and inspections are leading to a partial reduction in decentralization, an increase in costs, and, naturally, to a downward adjustment of capitalization. Uncertainty and expectations are factors that could lead to a sharp decrease in prices, as well as to a subsequent precipitous growth. The current year 2018 will be a year of regulation and formation of the legal framework for circulation of cryptocurrencies.
This has a positive side related to a reduction in risks, an increase in guarantees, and the appearance of clearer legal rules and liability of all institutions and participants of the cryptocurrency market.
2. General analysis of the ICO market (by week, month).
2.1 Brief market overview, news of the week
- China to Ban & Block Foreign Cryptocurrency Trading Platforms, ICOs: Report [source: CCN.com]
- The new project is going to hold the world’s first token sale event incorporating the elements of Decentralized Autonomous Organizations (DAO) [source: Coinspeaker]
- 7 Tough Legal Lessons for Crypto Entrepreneurs [source: Coindesk]
- What is the Nxt Platform, and What Can It be Used For? [source: Coinspeaker]
2.2. Aggregated trends and performance indicators of past (completed) ICOs
A set of tools is proposed to assess the trends and performance of successfully completed and/or listed ICOs (see Table 2.1).
Table 2.1. Tools to assess the market performance of successfully completed and/or listed ICOs
| Indicator | Description |
| Average collected funds (ACF) | Average amount of funds collected per ICO project over the period (month, quarter, year). |
| Average token performance (ATP)
|
Average performance of funds spent on buying tokens or average ratio between the current token price and token sale price over the period (month, quarter, year), i.e. the average reward per $1 spent on buying tokens during the token sale, if they are traded on exchanges for USD. |
| Weighted average current reward on ICO funds (WACRF) | Average weighted current performance of funds spent on buying tokens over the period (month, quarter, year). This indicator is similar to the previous indicator Average token performance (ATP), but is calculated taking into consideration the weight of the indicator. The parameter “average collected funds” (ACF) is used as a weight. |
| Weighted average monthly reward on ICO funds (WAMRF) | Average weighted monthly performance of funds spent on buying tokens over the period (month, quarter, year). This indicator is similar to the previous indicator, Weighted average current reward on ICO Funds (WACRF), but is calculated based on recalculated average monthly performance |
Table 2.2. Aggregated trends and performance indicators of past (completed) ICOs4
| Indicator | Total
2017 |
December
2017 |
January
2018 |
February 1-4,
2018 |
| Total amount of funds collected, USD million1 | 6 037.7 | 1 627.1 | 1529.6 | 240.5 |
| Number of companies that completed an ICO1 | 382 | 74 | 82 | 7 |
| Maximum collected, USD million (ICO name) | 258
(Hdac) |
258
(Hdac) |
100
(Envion) |
46
(IUNGO) |
| Average collected funds, USD million | 15.8 | 22 | 18.7 | 34.4 |
| Max token reward (ICO name) | 6 398.61x (Spectrecoin) | 13.55х
(Aelf) |
16.89x
(Zilliqa) |
n/a |
| Average token reward (ATR)2 | 47.86x | 10.04x | 3.34 | n/a |
| Weighted average current reward on funds (WACRF)3 | 9.91x | 8.56x | 2.15 | n/a |
Notes:
1 Data source: tokendata.io, icodrops.com, icodata.io, coinschedule.com. Only popular and/or successfully completed ICOs (i.e. ICOs which managed to collect the minimum set amount of funds) and/or ICOs listed on exchanges were considered. For some ICOs information may currently be incomplete (for instance, the amount of funds collected).
2 Average token reward on ICO projects during 2017 and 2018. For example, token reward or the ratio between the current token price and the token sale price, i.e. the average reward per USD 1 spent on tokens during the token sale, if they are subsequently listed for USD on a cryptocurrency exchange, equals $47.86 for projects completed in 2017. To calculate this ratio, the authors used the data from 382 ICOs completed in 2017. The maximum token reward for projects completed in 2017 was 6,398.61x for the Spectrecoin ICO (based on the assessment made on January 4, 2018).
3 Weighted average current reward on funds (WACRF) is an indicator similar to Average token reward (ATR), but takes into consideration the weight of the amount of funds collected through an ICO (see the Glossary).
4 The data for many ICOs are incomplete or non-existent.
The data for January 22-28, 2018, were adjusted to account for the appearance of more complete information on past ICOs. Last week (January 29-February 4, 2018) the amount of funds collected via ICOs equaled $381.7 million. This amount includes the results of the 19 most successful completed ICOs, with the largest amount collected equaling around $46 million (iungo ICO). The amount of funds collected over the first days of February equaled at least $240.5 million. More detailed information on the 19 main ICOs completed over the past week is given in Table 2.5.
2.3. Aggregated indicators to assess the market of active and planned ICOs
Table 2.3. Aggregated indicators to assess the market of active and planned ICOs
| Indicator | Value |
| Number of projects conducting an active ICO as of the current date (February 4, 2018) | 234 |
| Number of projects planning an ICO as of the current date (February 4, 2018) | 137 |
| Number of projects planning an ICO between February 5-11, 2018 | 23 |
Data source: tokendata.io, icodata.io, coinschedule.com, coingecko.com, icodrops.com, smithandcrown.com and icoalert.com
The number of projects conducting active ICOs as of February 4, 2018, is 234. There is presently information available on at least 137 planned ICOs to be conducted after February 4, 2018, including at least 23 ICOs which will start next week.
2.4. Quantitative analysis of the ICO market
2.4.1 Amount of funds collected and number of ICOs
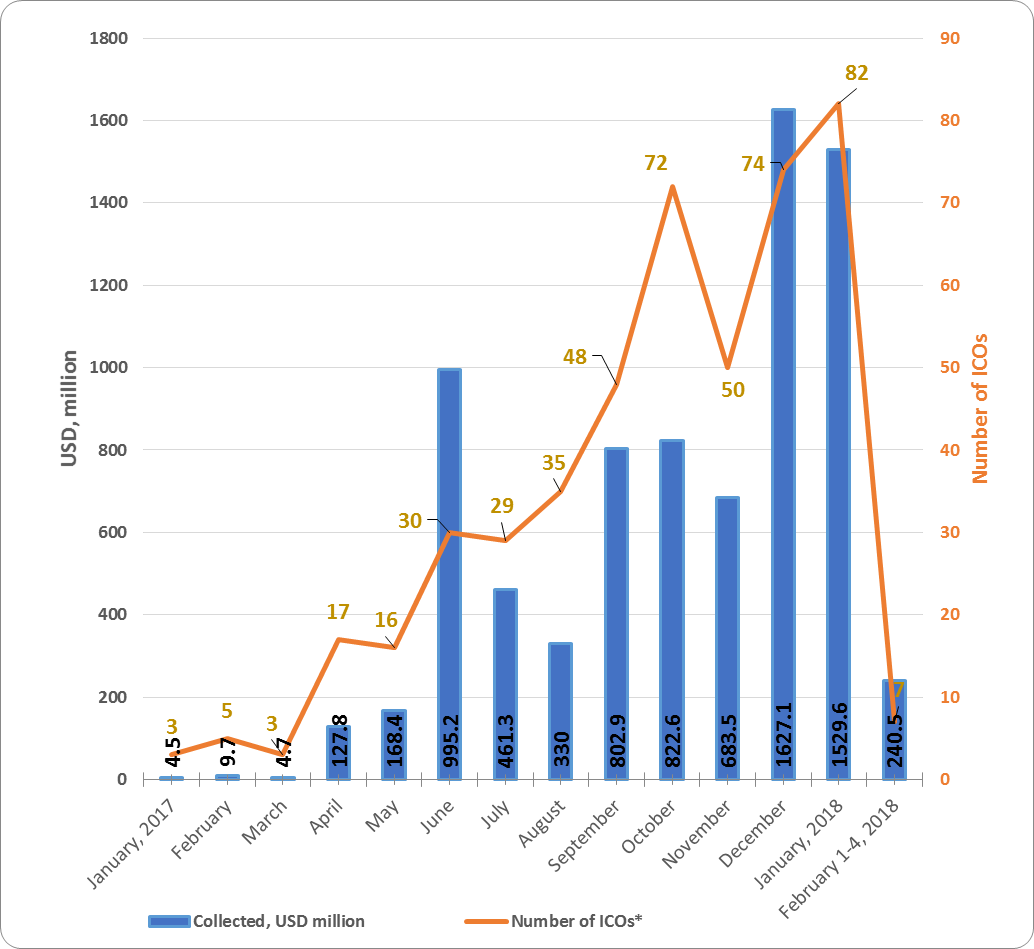
Table 2.4. Amount of funds collected and number of ICOs
| Month | Collected, $ million | Number of ICOs* | Average collected, $ million |
| January 2017 | 4.5 | 3 | 1.5 |
| February | 9.7 | 5 | 1.94 |
| March | 4.7 | 3 | 1.57 |
| April | 127.8 | 17 | 7.52 |
| May | 168.4 | 16 | 10.53 |
| June | 995.2 | 30 | 33.17 |
| July | 461.3 | 29 | 15.91 |
| August | 330 | 35 | 9.43 |
| September | 730.3 | 45 | 16.23 |
| October | 794.2 | 68 | 11.7 |
| November | 683.5 | 50 | 13.7 |
| December | 1 627.1 | 74 | 22 |
| January 2018 | 1529.6 | 82 | 18.7 |
| February 1-4, 2018 | 240.5 | 7 | 34.4 |
| Total | 7807.8 | 471 | 16.6 |
* Information on funds collected is not available for all ICOs (information for last week is tentative and may be adjusted).
Table 2.4 shows that the greatest amount of funds was collected via ICOs in December 2017. The average funds collected per ICO in that month equaled $22 million.
The data for last week (January 29-February 4, 2018) may be adjusted as information on the amounts of funds collected by completed ICOs is finalized.
Figure 2.1. Trends in funds collected and number of ICOs since the start of 2017
2.4.2 Top ICOs
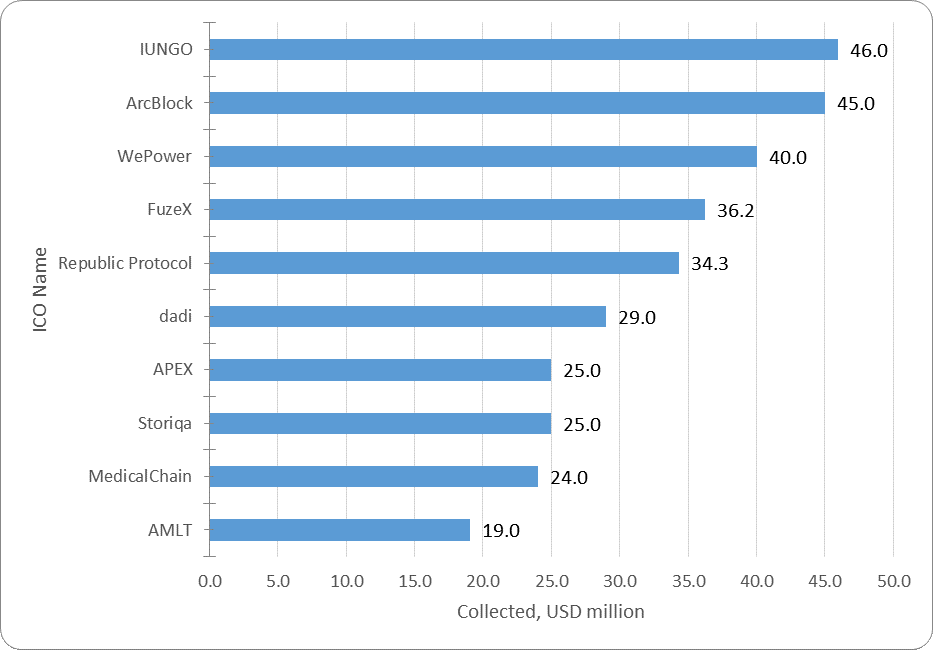
Table 2.5. Top 10 ICOs in terms of the amount of funds collected (January 29-February 4, 2018)
| № | Name of ICO*** | Category* | Collected, $ million | Date |
| 1 | IUNGO | Mobile | 46.0 | February 1, 2018 |
| 2 | ArcBlock | Blockchain Service | 45.0 | February 4, 2018 |
| 3 | WePower | Energy | 40.0 | February 1, 2018 |
| 4 | FuzeX | Card | 36.2 | February 2, 2018 |
| 5 | Republic Protocol | Trading | 34.3 | February 3, 2018 |
| 6 | dadi | Cloud Storage | 29.0 | January 29, 2018 |
| 7 | APEX | Blockchain Service | 25.0 | January 29, 2018 |
| 8 | Storiqa | Marketplace | 25.0 | January 29, 2018 |
| 9 | MedicalChain | Healthcare | 24.0 | February 1, 2018 |
| 10 | AMLT | Blockchain Service | 19.0 | January 30, 2018 |
| Top-10 ICOs | 323.5 | |||
| Total funds collected from January 29-February 4, 2018 (19 ICOs)** | 381.7 | |||
| Average funds collected | 20.1 |
* The category was established based on the data of icodrops.com or based on expert opinions.
** When compiling the lists of top ICOs, information from the websites tokendata.io, icodrops.com, icodata.io, coinschedule.com and other specialized sources is used.
*** Only popular and/or successfully completed ICOs (i.e. ICOs which managed to collect the minimum set amount of funds) and/or ICOs listed on exchanges were considered. Information may be incomplete for some ICOs (for instance, the amount of funds collected).
Table 2.5 shows the top 10 ICOs which were successfully completed over the past week (January 29-February 4, 2018). The leader for the week was the IUNGO project, which positions itself as a decentralized internet provider uniting internet users from around the world into a global WiFi network on the Ethereum blockchain.
Figure 2.2 presents the ten largest ICOs completed last week.
Figure 2.2. Top 10 ICOS in terms of the amount of funds collected (Jan 29-Feb 4, 2018)
2.4.3 Top ICOs during January 2018
Table 2.6. Top 10 ICOs in terms of the amount of funds collected during January 2018
| Name of ICO | Category | Collected, $ million | % | Date | Token performance | |
| 1 | Envion | Mining | 100 | 16% | January 15, 2018 | n/a |
| 2 | Elastos | Infrastructure | 94.1 | 15% | January 23, 2018 | 3.66x |
| 3 | Neuromation | Network | 71.7 | 11% | January 7, 2018 | n/a |
| 4 | Zeepin | Data storage | 62.6 | 10% | January 18, 2018 | 0.77x |
| 5 | Olympus Labs | Finance | 60.3 | 10% | January 14, 2018 | 0.36x |
| 6 | Crypterium | Payments | 51.7 | 8% | January 6, 2018 | 0.51x |
| 7 | SwissBorg | Finance | 50.9 | 8% | January 9, 2018 | 0.79x |
| 8 | Odyssey | Infrastructure | 50 | 8% | January 23, 2018 | 2.37x |
| 9 | Bloom | Finance | 43.8 | 7% | January 1, 2018 | 0.69x |
| 10 | Nucleus.Vision | Infrastructure | 40 | 6% | January 28, 2018 | n/a |
| Top 10 ICOs, January 2018 | 625.1 | 100% |
* The category was established based on expert opinions.
The three leaders were projects from the Mining, Infrastructure and Network categories. At present, all projects from the top 10 projects for January 2018 have a token performance indicator of 0.36x to 3.66x. The Elastos ICO can be considered one of the most successful exchange listings, as this project has a current token price to token sale price ratio of 3.66x. When considering this indicator, it is important to remember that the Elastos ICO was completed on January 23, 2018, i.e. the 3.66x growth took place over less than one month amid a fall in the total cryptocurrency market capitalization during this period of approximately 20%.
Figure 2.3 Top 10 ICOs in terms of the amount of funds collected during January 2018
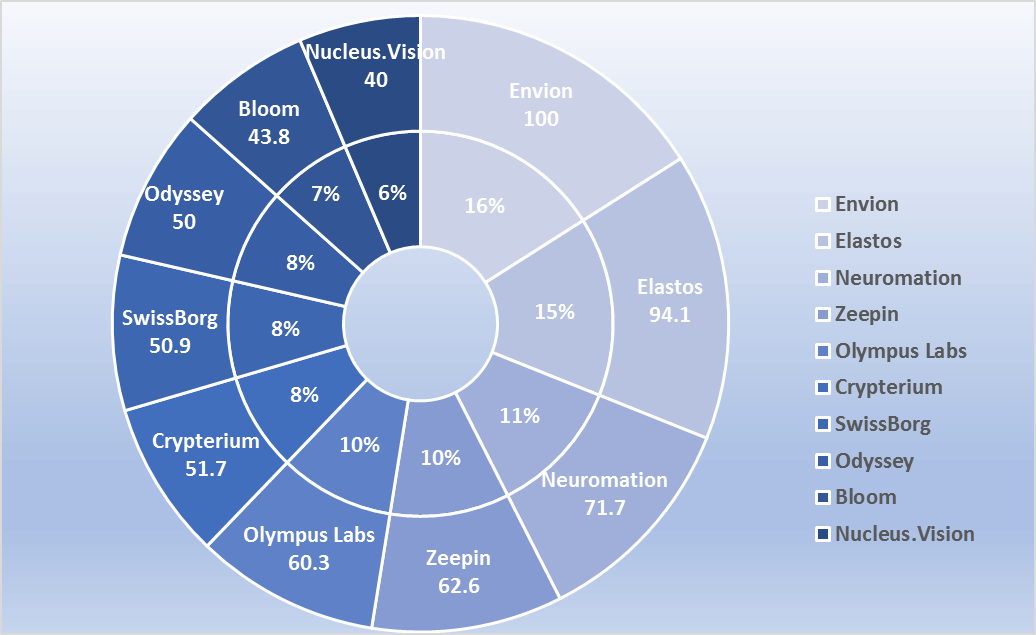
Over the past period (January 29-February 4, 2018), 19 ICO projects were successfully completed, each of which collected more than $100,000, with a total amount of funds collected of around $381.7 million. More than $1.5 billion were collected in January. The leader for the last week was the IUNGO project ($46 million), and the leader for January 2018 was the Envion project ($100 million). The total amount of funds collected by a number of ICOs failed to reach even the $100,000 mark (the information for some projects is still being finalized).
The Glossary is given in Annex 1.
Annex 1 – Glossary
| Key terms | Definition |
| Initial coin offering, ICO | A form of collective support of innovative technological projects, a type of presale and attracting of new backers through initial coin offerings to future holders in the form of blockchain-based cryptocurrencies (tokens) and digital assets. |
| Market capitalization | Value of an asset calculated based on its current market (exchange) price. This economic indicator is used to assess the total aggregate value of market instruments, players, and markets. [Source: https://en.wikipedia.org]. |
| Cryptocurrency market capitalization | Aggregate market value of cryptocurrencies circulating on the market. |
| Total cryptocurrency market capitalization | Cryptocurrency and digital asset market capitalization, i.e. the aggregate market value of all cryptocurrencies and digital assets circulating on the market. |
| Token reward | Token performance (current token price / token sale price during the ICO), i.e. the reward per $1 spent on buying tokens. |
| Dominance | Market share, i.e. the ratio of market capitalization of a particular cryptocurrency (token) to total cryptocurrency market capitalization. Expressed as a %. |
| Token sale price
Current token price |
Token sale price during the ICO.
Current token price. |
| Not Mineable
|
A coin that is not mineable. The term is used for cryptocurrencies (tokens) which cannot be mined or issued through mining. |
| Pre-mined | A pre-mined coin. The term is used for cryptocurrencies (tokens) which are issued through mining, and a certain number of coins (tokens) have been created and distributed among certain users at the start of the project. |
| The rate of market increase (as a % compared to the beginning of the year) | The rate of market increase (as a % compared to the start of the year), i.e. by how many % points did market capitalization increase compared to the start of the year. |
| The growth rate of the market (as a % compared to the beginning of the year) | The market growth (as a % compared to the start of the year), i.e. by how many times did market capitalization grow compared to the start of the year. |
| Increase in market capitalization (in USD million compared to the previous period) | Increase in cryptocurrency and digital asset market capitalization (in USD million compared to the previous period), i.e. by how many USD million did market capitalization increase over the period. |
| The rate of market increase (as a % compared to the previous period) | Rate of market increase (as a % compared to the previous period), i.e. by how many % points did market capitalization increase over the period. |
| The market growth rate (as a % compared to the previous period) | Market growth rate (as a % compared to the previous period), i.e. by how many times did market capitalization grow compared to the previous period. |
| Number of cryptocurrencies and digital assets | Number of cryptocurrencies and digital assets. At the time when this glossary was compiled over 1,070 cryptocurrencies and digital assets were circulating on the market. |
| Average market capitalization | Average market capitalization, i.e. the ratio of the market capitalization of all cryptocurrencies and digital assets to their number. |
| Token return | Performance of funds spent on buying tokens or the ratio of the current token price to the token sale price, i.e. performance of $1 spent on buying tokens during the token sale, if listed on an exchange for USD. |
| ETH reward – current dollar value of $1 spent on buying tokens during the token sale | Alternative performance indicator of funds spent on buying tokens during the ICO or the ratio of the current ETH rate to its rate at the start of the token sale, i.e. if instead of buying tokens $1 was spent on buying ETH at its rate at the start of the token sale and then it was sold at the current ETH rate. |
| BTC reward– current dollar value of $1 spent on buying tokens during the token sale | Similar to the above: Alternative performance indicator of funds spent on buying tokens during the token sale, i.e. if instead of buying tokens $1 was spent on buying BTC at its rate at the start of the token sale and then it was sold at the current BTC rate. |
| Token/ETH reward | This ratio describes the backer’s economic benefits and disadvantages resulting from buying tokens during the token sale relative to buying ETH. If the result is over 1, the backer spent his funds more efficiently on buying tokens than if he were to have spent his funds on ETH. |
| Token/BTC reward | This ratio describes the backer’s economic benefits and disadvantages resulting from buying tokens during the token sale relative to buying BTC. If the result is over 1, the backer spent his funds more efficiently on buying tokens than if he were to have spent his funds on BTC. |
| ZAK-n Crypto index | The index is calculated as a percentage and represents a ratio between the 24-hour trading volume (transactions) on cryptocurrency exchanges per day (Volume 24h) for n dominant cryptocurrencies to their total market capitalization.
ZAK-4 Crypto index calculations include four dominant cryptocurrencies with the greatest market capitalization: Bitcoin, Ethereum, Bitcoin Cash, and Ripple. ZAK-8 Crypto index calculations include the trading volume and market capitalization for eight cryptocurrencies. |
The post Monthly Cryptocurrency and ICO Market Analysis [January 2018] appeared first on CoinSpeaker.