
Information as of January 28, 2018
This report was created by:
- Professor Dmitrii Kornilov, Doctor of Economics, Member of the Russian Academy of Natural Sciences, and Leading Analyst at ICOBox;
- Dima Zaitsev, PhD in Economics, Head of International Public Relations and Business Analytics Department Chief at ICOBox;
- Nick Evdokimov, Co-Founder of ICOBox;
- Mike Raitsyn, Co-Founder of ICOBox;
- Anar Babaev, Co-Founder of ICOBox;
- Daria Generalova, Co-Founder of ICOBox;
This report presents data on the cryptocurrency and ICO market changes during 2017-2018, with special emphasis on an analysis of the changes that have taken place since the beginning of January 2018, including over the last week (January 22-28, 2018).
1. General cryptocurrency and digital assets market analysis (by week, month, quarter). Market trends.
1.1 General cryptocurrency and digital assets market analysis (by week, month).
Table 1.1. Trends in capitalization of the cryptocurrency market and main cryptocurrencies from December 1, 2017, to January 28, 2018*
| Parameter | 1-Dec-17 | 1-Jan-18 | MoM, % | 7-Jan-18 | DoD, % | 14-Jan-18 | DoD, % | 21-Jan-18 | DoD, % | 28-Jan-18 | DoD, % | |
| 1 | Total market capitalization, USD billion | 305.1 | 612.9 | 100.9% | 815.2 | 33% | 744.3 | -8.7% | 630.6 | -15.3% | 562 | -10.9% |
| 2 | Altcoin market capitalization, USD billion | 134.7 | 376.2 | 179.3% | 520.9 | 38.5% | 502.8 | -3.5% | 413.9 | -17.7% | 368.8 | -10.9% |
| Altcoin dominance, % | 44.1% | 61.4% | – | 63.9% | – | 67.6% | – | 65.6% | – | 65.6% | – | |
| 3 | Bitcoin price, $ | 10 198.6 | 14 112.2 | 38.4% | 17 527.3 | 24.2% | 14 370.8 | -18% | 12 889.2 | -10.3% | 11 475.3 | -11% |
| Bitcoin market capitalization, USD billion | 170.4 | 236.7 | 38.9% | 294.2 | 24.3% | 241.4 | -17.9% | 216.7 | -10.2% | 193.1 | -10.9% | |
| Bitcoin dominance, % | 55.9% | 38.6% | – | 36.1% | – | 32.4% | – | 34.4% | – | 34.4% | – | |
| 4 | Ethereum price, $ | 445.2 | 755.8 | 69.8% | 1 043 | 38% | 1 397.5 | 34% | 1 155.7 | -17.3% | 1 111.8 | -3.8% |
| Ethereum market capitalization, USD billion | 42.8 | 73.1 | 70.9% | 101 | 38.2% | 135.5 | 34.2% | 112.2 | -17.2% | 108.1 | -3.7% | |
| Ethereum dominance, % | 14% | 11.9% | – | 12.4% | – | 18.2% | – | 17.8% | – | 19.2% | – | |
| 5 | Bitcoin Cash price, $ | 1 381.8 | 2 534.8 | 83.4% | 2 784.7 | 9.9% | 2 687.1 | -3.5% | 2 033.7 | -24.3% | 1 636.4 | -19.5% |
| Bitcoin Cash market capitalization, USD billion | 23.3 | 42.8 | 84.1% | 47.1 | 9.9% | 45.4 | -3.4% | 34.4 | -24.3% | 27.7 | -19.5% | |
| Bitcoin Cash dominance, % | 7.6% | 7% | – | 5.8% | – | 6.1% | – | 5.5% | – | 4.9% | – | |
| 6 | Litecoin price, $ | 88 | 231.7 | 163.3% | 296.1 | 27.8% | 260.6 | -12% | 211.2 | -18.9% | 181.4 | -14.1% |
| Litecoin market capitalization, USD billion | 4.8 | 12.6 | 165.6% | 16.2 | 28% | 14.3 | -11.8% | 11.6 | -18.8% | 10 | -14% | |
| Litecoin dominance, % | 1.6% | 2.1% | – | 2% | – | 1.9% | – | 1.8% | – | 1.8% | – | |
| 7 | Smith + Crown Index | 18 058 | 27 543 | 52.5% | 34 190 | 24.1% | 33 556 | -1.9% | 29 217 | -12.9% | 27 019 | -7.5% |
| 8 | Volume (24h) 4 crypto, USD billion | 9.2 | 15.7 | 71.1% | 25.3 | 61% | 18.9 | -25.2% | 16.9 | -10.6% | 15.6 | -7.5% |
| Market cap 4 crypto, USD billion | 246.1 | 441.6 | 79.4% | 562.1 | 27.3% | 500.6 | -10.9% | 424.4 | -15.2% | 376.4 | -11.3% | |
| ZAK-4 Crypto index | 3.7% | 3.6% | – | 4.5% | – | 3.8% | – | 4% | – | 4.2% | – | |
| 4 crypto dominance, % | 80.7% | 72% | – | 69% | – | 67.3% | – | 67.3% | – | 67% | – | |
| 9 | Volume (24h) 8 crypto, USD billion | 10.3 | 17.2 | 67.5% | 27 | 57% | 20.1 | -25.6% | 18.7 | -7.1% | 16.8 | -10.2% |
| Market cap 8 crypto, USD billion | 263.5 | 488.6 | 85.4% | 632.4 | 29.4% | 563.3 | -10.9% | 475.1 | -15.7% | 422.6 | -11.1% | |
| ZAK-8 Crypto index | 3.9% | 3.5% | – | 4.3% | – | 3.6% | – | 3.9% | – | 4% | – | |
| 8 crypto dominance, % | 86.4% | 79.7% | – | 77.6% | – | 75.7% | – | 75.3% | – | 75.2% | – |
* Data as of January 28, 2018 (all figures calculated at 00:00 UTC)
** After December 1, 2017, the ZAK-4 index was calculated using the cryptocurrencies Bitcoin, Ethereum, Bitcoin Cash, and Ripple.
*** When calculating the ZAK-8 index, the cryptocurrencies with the largest capitalization are used. At present (January 28, 2018), the cryptocurrencies Bitcoin, Ethereum, Bitcoin Cash, Ripple, Litecoin, Cardano, Stellar and NEO are used.
Data source: coinmarketcap.com, https://www.smithandcrown.com
According to the data of coinmarketcap.com (at 00:00 UTC), during the analyzed period (January 22-28, 2018) there was a fall in market capitalization by 10.9%, to $562 billion. For the third week in a row capitalization has shown a downward trend, with the Smith + Crown Index, in turn, dropping from 34,190 to 27,019. The dominance of the four and eight largest cryptocurrencies as of January 28, 2018, (00:00 UTC) equaled 67% and 75.2%, respectively (see Table 1.1).
Last week total cryptocurrency market capitalization ranged from $490 billion to $630 billion, which led to a depreciation in the prices of 15 of the top 20 cryptocurrencies in terms of capitalization.
The growth and fall of cryptocurrency prices over the past week (January 22-28, 2018)
The prices of some cryptocurrencies may fluctuate from -50% to +50% over the course of a single day. Therefore, when performing an analysis of cryptocurrency price trends, it is advisable to use their average daily amounts on various cryptoexchanges.
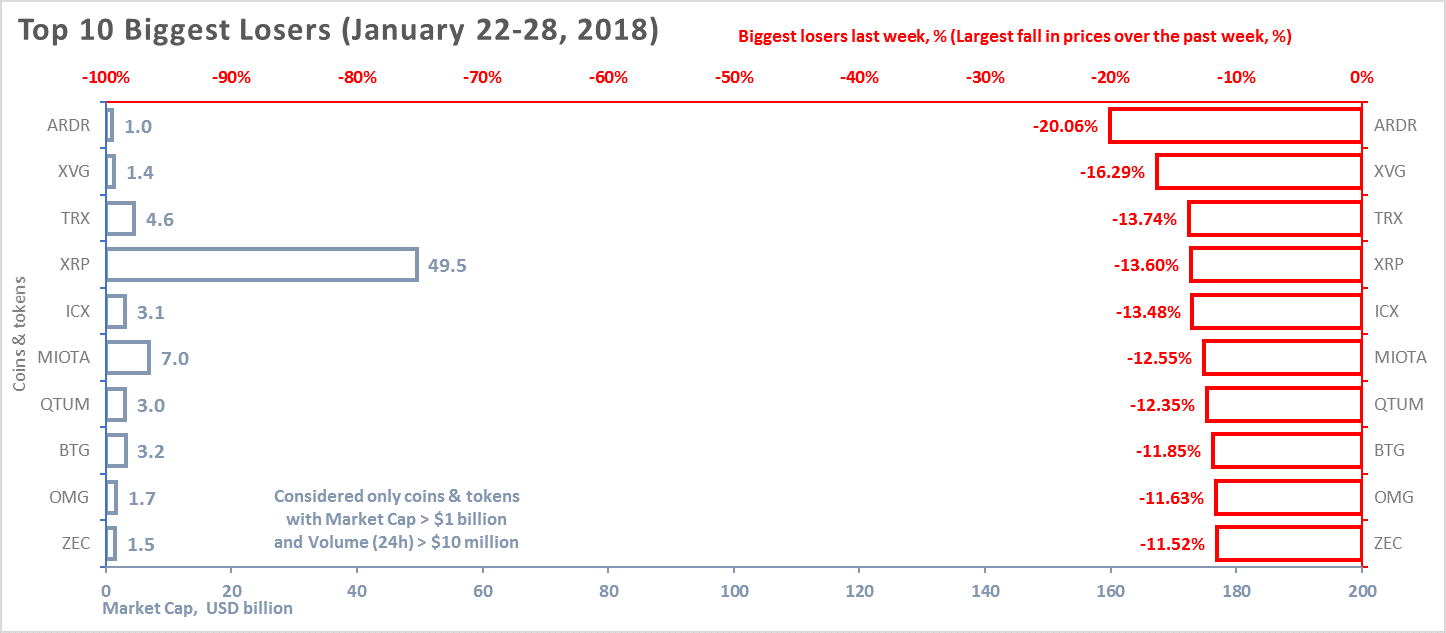
Below we consider the top 10 cryptocurrencies that showed the largest drop or gain in price over the past week (fig. 1, 2). In this regard, only those coins and tokens with a market capitalization of over $1 billion and a 24-hour trading volume of more than $10 million (according to the data of coinmarketcap.com) were considered.
Data source: coinmarketcap.com
The change in price was calculated based on average daily data.
Figure 1. Largest fall in prices over the past week
Data source: coinmarketcap.com
The change in price was calculated based on average daily data.
Tables 1.2 and 1.3 show the possible factors or events that could have had an influence on the fluctuation in prices for certain cryptocurrencies. Table 1.4 shows the possible factors or events that could have had an influence on the cryptocurrency market in general.
Since the volatility of each digital asset or cryptocurrency is connected with overall trends on the cryptocurrency market, the fall in the prices of individual cryptocurrencies over the past week by 0-10% is completely understandable.
Table 1.2 Factors and events that could have led to a fall in cryptocurrency prices over the past week
| № | Coins and tokens | Symbol | Fall in price over the week, % | Average price in $ on Jan 28, 2018 | Market capitalization, USD billion | Factors and events that could have led to a fall in cryptocurrency prices over the past week |
| 1 | Ardor | ARDR | 20.06% | 1.00 | 1 | There was no bad news related to Ardor, in fact on January 23 an announcement on the update of the platform and the elimination of bugs was published. The factors leading to the fall of Ardor were most likely tied in with the cryptocurrency market development cycle, which showed a downward trend last week. After reaching a peak price of $2.50 on January 16, Ardor began to fall, together with the entire market, amid the news from South Korea and the expiration of the first bitcoin futures. |
| 2 | Verge | XVG | 16.29% | 0.09 | 1.4 | Despite the fork performed on January 24, Verge lost more than 16% over the week, which might be attributable to the volatility typical for this cryptocurrency over the past few months and the overall trends on the cryptocurrency market. |
| 3 | TRON | TRX | 13.74% | 0.07 | 4.6 | Tron began trading on Bitfinex and announced its impending listing on another cryptoexchange, but this did not help it to escape the negative trend that began after the sharp fall in its price on January 5. |
| 4 | Ripple | XRP | 13.6% | 1.28 | 49.5 | Despite the favorable news on its new partnership with Mercury FX and IDT, which plan to use xRapid for transfers, the Ripple price continues to fall steadily from its record high of $3.50 on January 4. This negative trend can be tied to the downward trend of Ripple and the cryptocurrency market as a whole. Also, experts explain the growth in Ripple that started at the end of 2017 with the heightened demand formed by major players. The Ripple price was affected to a certain degree this week by the issue of a rating of cryptocurrencies by the respected rating agency Weiss Ratings, which assigned the currency a somewhat disappointing “C” rating. Meanwhile, Ethereum, Ripple’s main competitor, was assigned the “B” rating. None of the cryptocurrencies received the highest “A” rating. |
| 5 | ICON | ICX | 13.48% | 8.21 | 3.1 | Icon has shown high volatility throughout the last month and, since it was not the subject of bad news over the past week, it is safe to conclude that the fall in its token price was due to market trends. |
| 6 | IOTA | MIOTA | 12.55% | 2.51 | 7 | The MIOTA community and developers kept their news to themselves last week, and it is possible that the price of the cryptocurrency changed in line with the negative trends on the market which started in late December 2017, when it hit its record high of nearly $5.70. |
| 7 | Qtum | QTUM | 12.35% | 41.27 | 3 | This cryptocurrency, together with other currencies, was assigned a relatively low “C” rating by Weiss Ratings. Therefore, the fall in the price corresponds to overall trends on the cryptocurrency market. |
| 8 | Bitcoin Gold | BTG | 11.85% | 190.31 | 3.2 | Bitcoin Gold received a fairly low rating in the recently published cryptocurrency ratings of Weiss Ratings. The assignment of a “D+” rating means that this cryptocurrency is not very attractive. |
| 9 | Omise GO | OMG | 11.63% | 16.40 | 1.7 | The change in the prices of OmiseGo and Zcash last week can be regarded as volatility corresponding to overall cryptocurrency market trends. |
| 10 | Zcash | ZEC | 11.52% | 464.18 | 1.5 |
A general conclusion can be made about the sensitivity of some cryptocurrencies and digital assets to overall market changes: the greater their growth during a period of cryptocurrency market growth, the larger their fall during a downward adjustment. Even during the downswing of the cryptocurrency market, some cryptocurrencies and digital assets with a capitalization of more than $1 billion showed fairly good growth last week (fig. 2).
Figure 2. Largest growth in prices over the last week
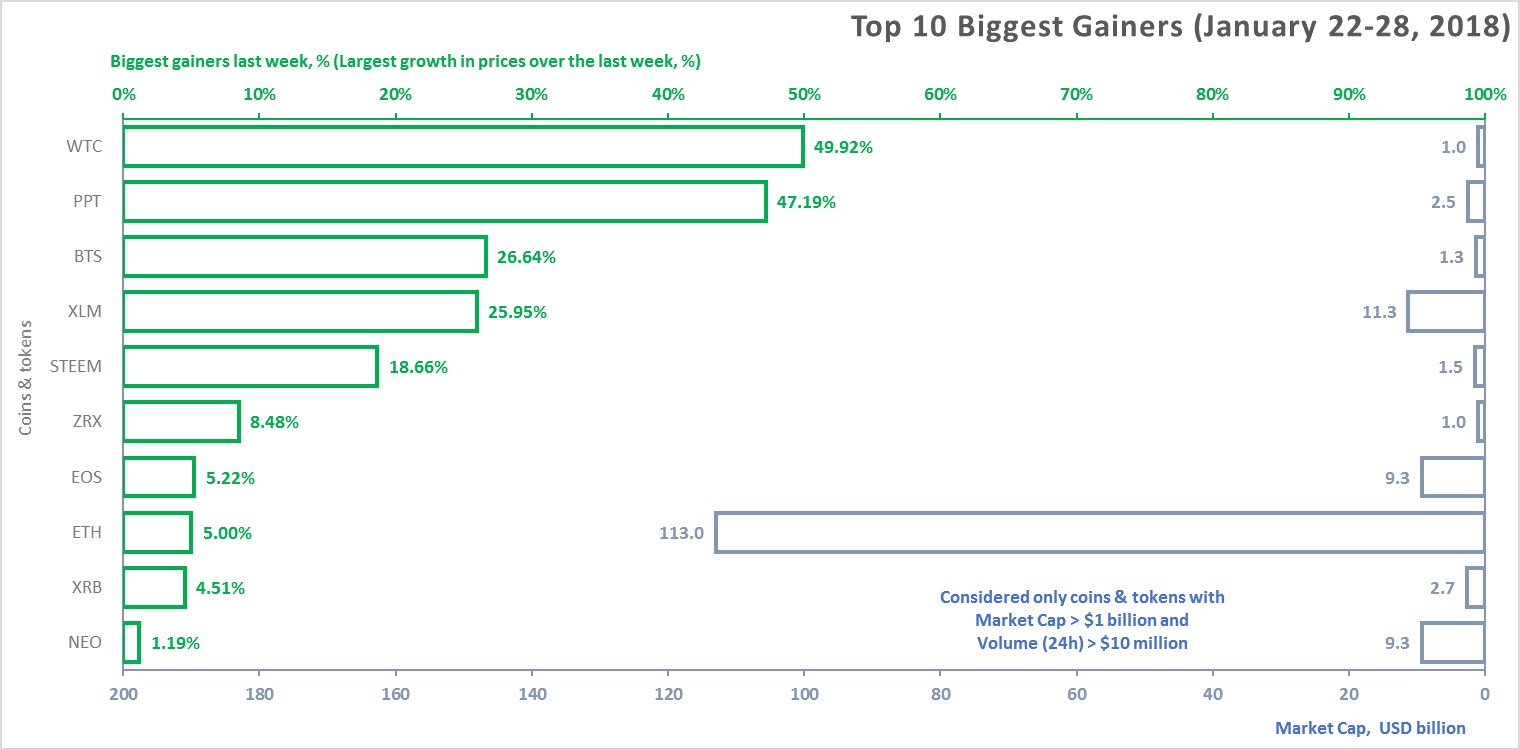
Table 1.3 Factors and events that could have led to a growth in cryptocurrency prices over the past week
| № | Coins and tokens | Symbol | Growth in price over the week, % | Average price in $ on Jan 28, 2018 | Market capitalization, USD billion | Factors and events that could have led to a growth in cryptocurrency prices over the past week |
| 1 | Walton | WTC | 49.92% | 41.15 | 1 | Walton began appreciating in early January with a string of favorable news items on its listing on a new exchange, the commencement of its work with a Chinese association of mobile IoT and the upgrade of the improved version of its wallet. The growth in the token last week was most likely due to the news on the upcoming announcement of a new partnership. |
| 2 | Populous | PPT | 47.19% | 67.76 | 2.5 | Populous did not make any announcements on its Twitter account other than an invitation to try out a simulation of the beta version of its platform. Total trading ranged from $2-6 million, which is quite low compared to the token’s capitalization. |
| 3 | BitShares | BTS | 26.64% | 0.51 | 1.3 | It is possible that the main reason for the growth in the Bitshares cryptocurrency was the positive rating it received from Weiss Ratings (a “C+” rating). This shows that the project is promising and worthy of attention. This hypothesis is supported by the fact that the price began to grow on January 24, on the day when the rating was published. |
| 4 | Stellar | XLM | 25.95% | 0.63 | 11.3 | Stellar issued a new roadmap last week, and announced that it is preparing to launch the OpenGarden cryptocurrency on its main network, which together could account for its growth. |
| 5 | Steem | STEEM | 18.66% | 6.20 | 1.5 | The main event of the week for Steem was the receipt of a favorable rating from Weiss Ratings, which placed this cryptocurrency in the top five of the 74 analyzed cryptocurrencies. Its rapid growth began on the date of publication of the rating, January 24. |
| 6 | 0x | ZRX | 8.48% | 2.02 | 1 | The 15% appreciation in the 0x token may be indirectly linked to the news published on the project’s Twitter channel on January 26. |
| 7 | EOS | EOS | 5.22% | 14.72 | 9.3 | EOS was assigned a high “B” rating by the Weiss Ratings agency. |
| 8 | Ethereum | ETH | 5% | 1161.99 | 113 | Ethereum was one of the few cryptocurrencies that was given a high “B” rating by Weiss Ratings agency. Ethereum’s founder announced that the platform is getting ready for the launch of Sharding technology, which is intended for scaling of the network. |
| 9 | RaiBlocks | XRB | 4.51% | 20.22 | 2.7 | The issue of a new Whitepaper on January 24 helped RaiBlocks to overcome its negative trend and even show slight growth over the week. |
| 10 | NEO | NEO | 1.19% | 143.71 | 9.3 | The growth of the NEO price was triggered by the positive rating from Weiss Ratings. |
Based on the results of last week, only 12 of the cryptocurrencies with a capitalization of more than $1 billion showed a positive price trend.
Table 1.4 gives a list of events that took place from January 22-28, 2018, and had an impact on both the prices of the dominant cryptocurrencies and the market in general, with an indication of their nature and type of impact
Table 1.4. Key events of the week having an influence on cryptocurrency prices, January 22-28, 2018
| № | Factors and events
(link to source) |
Date of news | Date of event* | Description | Nature of impact | Type of impact |
| 1. | 3,000 Metric Tons of Wheat Was Recently Traded for Bitcoin [source: Bitcoin.com] | January 24, 2018 | January 24, 2018 | The purchase of three metric tonnes of grain by a Turkish company from a Russian company based in Rostov became one of the largest transactions ever conducted in cryptocurrency. If this method of settlement turns out to be more convenient for market participants, more companies may begin to work with cryptocurrencies. | BTC ⇑ | Favorable |
| 2. | ‘Not True’: Goldman Denies Bitcoin Trading Rumor [source: Coindesk] | January 24, 2018 | January 24, 2018 | At the World Economic Forum in Davos, the CEO of Goldman Sachs announced that the rumors that the company had launched its own cryptocurrency trading platform were not true. | Market ⇓ | Unfavorable |
| 3. | Weiss Publish Their First Cryptocurrency Ratings [source: NewsBTC] | January 25, 2018 | January 25, 2018 | For the first time, a ratings agency that specializes in financial institutions has published a rating of cryptocurrencies. Several cryptocurrencies (including Ethereum, NEO, and Steem) received the highest rating assigned, a “B”. Bitcoin received a “C” rating, probably because of its problems with scalability. | Market BTC ⇓ETH ⇑ Neo ⇑ Steem ⇑ |
Uncertain |
| 4. | South Korean Government Announces That No Major South Korean Cryptocurrency Exchanges Could Pass Personal Data Protection Audit [source: KCC.GO.KR] | January 25, 2018 | January 25, 2018 | During the audit it was discovered that all major South Korean exchanges violate the Personal Data Protection Act. This undermines trust in them, and could prompt an outflow of clients or even the refusal of some clients to trade in cryptocurrency, since the people of South Korea do not have a safe alternative. This news also shows that regulation of cryptocurrency exchanges is only beginning, and even the most basic requirements such as personal data protection are not always met. | Market ⇓ | Unfavorable |
| 5. | Davos 2018: Leaders Remain Critical About Cryptocurrencies at the World Economic Forum [source: Coinspeaker] | January 26, 2018 | January 26, 2018 | For example, British Prime Minister Theresa May said that the possible ways to regulate cryptocurrencies should be considered “very seriously precisely because of the way they can be used, particularly by criminals” for tax evasion and money laundering. | Market ⇓ | Unfavorable |
| 6. | Japanese Cryptocurrency Exchange Loses More Than $500 Million to Hackers [source: CNBC] | January 26, 2018 | January 26, 2018 | The market fell steeply after the notorious hack of the first cryptoexchange MtGox and the theft of $400 million in 2014. The crypto industry is now much larger than in 2014, but this news still raises legitimate fears for anyone who keeps cryptocurrency on exchanges. Some may prefer to sell their cryptocurrency and get out of this already risky market for good. | Market ⇓ | Unfavorable |
* Event already took place
To analyze trading activity on cryptocurrency exchanges, the ZAK-n Crypto index is calculated (see the Glossary). The values of the ZAK-4 Crypto and ZAK-8 Crypto indices are presented in Tables 1.1, 1.5.a, and 1.5.b. For example, on January 4, 2018, the 24-hour trading volume (Volume 24h) for the four dominant cryptocurrencies (Bitcoin, Ethereum, Bitcoin Cash, and Ripple) exceeded $40 billion (Table 1.5.a). The value of the ZAK-4 Crypto equaled 8.1%, which attests to the extremely high liquidity and market dynamism of the dominant cryptocurrencies. By the start of the downturn on the cryptocurrency market (January 17, 2018) the value of the index had reached 9.7%, i.e. the daily turnover of cryptocurrencies equaled nearly 10% of total market capitalization.
Table 1.5.a. Daily ZAK-4 Crypto index calculation (from December 1, 2017, to January 28, 2018)
| Crypto | Bitcoin (BTC) | Ethereum (ETH) | Bitcoin Cash (BCH) | Ripple (XRP) | 4 Crypto | ||||||||||
| Price Open | Volume (24h) | Market cap | Price Open | Volume (24h) | Market cap | Price Open | Volume (24h) | Market cap | Price Open | Volume (24h) | Market cap | Volume (24h) 4 crypto | Market cap 4 crypto | ZAK-4 Crypto index | |
| Date | $ | USD billion | USD billion | $ | USD billion | USD billion | $ | USD billion | USD billion | $ | USD billion | USD billion | USD billion | USD billion | % |
| Jan 28, 2018 | 11 475 | 8.4 | 193.1 | 1 112 | 5.4 | 108.1 | 1 636 | 0.6 | 27.7 | 1.22 | 1.3 | 47.4 | 15.6 | 376.4 | 4.2% |
| Jan 27, 2018 | 11 175 | 7.6 | 188.1 | 1 056 | 3.0 | 102.7 | 1 603 | 0.4 | 27.1 | 1.22 | 0.7 | 47.2 | 11.7 | 365.0 | 3.2% |
| Jan 26, 2018 | 11 256 | 9.7 | 189.4 | 1 053 | 3.6 | 102.3 | 1 637 | 0.6 | 27.7 | 1.31 | 2.0 | 50.7 | 16.0 | 370.2 | 4.3% |
| Jan 25, 2018 | 11 422 | 8.9 | 192.2 | 1 063 | 4.1 | 103.3 | 1 661 | 0.5 | 28.1 | 1.36 | 1.0 | 52.8 | 14.4 | 376.4 | 3.8% |
| Jan 24, 2018 | 10 903 | 9.9 | 183.4 | 987 | 3.9 | 96.0 | 1 622 | 0.5 | 27.5 | 1.35 | 1.9 | 52.4 | 16.2 | 359.2 | 4.5% |
| Jan 23, 2018 | 10 945 | 9.7 | 184.1 | 1 004 | 3.6 | 97.6 | 1 623 | 0.6 | 27.5 | 1.35 | 3.0 | 52.4 | 16.8 | 361.5 | 4.6% |
| Jan 22, 2018 | 11 633 | 10.5 | 195.6 | 1 055 | 3.8 | 102.5 | 1 794 | 0.7 | 30.4 | 1.39 | 2.6 | 53.9 | 17.7 | 382.4 | 4.6% |
| Jan 21, 2018 | 12 889 | 9.9 | 216.7 | 1 156 | 3.4 | 112.2 | 2 034 | 0.7 | 34.4 | 1.58 | 2.8 | 61.1 | 16.9 | 424.4 | 4.0% |
| Jan 20, 2018 | 11 656 | 11.8 | 196.0 | 1 045 | 4.0 | 101.5 | 1 784 | 1.1 | 30.2 | 1.56 | 2.3 | 60.5 | 19.2 | 388.2 | 5.0% |
| Jan 19, 2018 | 11 430 | 10.7 | 192.2 | 1 029 | 4.1 | 99.9 | 1 740 | 0.7 | 29.4 | 1.58 | 3.7 | 61.3 | 19.3 | 382.7 | 5.0% |
| Jan 18, 2018 | 11 199 | 15.0 | 188.2 | 1 016 | 5.9 | 98.6 | 1 752 | 1.0 | 29.6 | 1.31 | 9.1 | 50.6 | 31.1 | 367.1 | 8.5% |
| Jan 17, 2018 | 11 431 | 18.8 | 192.1 | 1 061 | 8.5 | 103.0 | 1 768 | 1.5 | 29.9 | 1.18 | 7.3 | 45.9 | 36.1 | 370.9 | 9.7% |
| Jan 16, 2018 | 13 836 | 18.9 | 232.5 | 1 293 | 8.4 | 125.4 | 2 407 | 1.7 | 40.7 | 1.68 | 5.7 | 65.0 | 34.7 | 463.6 | 7.5% |
| Jan 15, 2018 | 13 767 | 12.8 | 231.3 | 1 365 | 4.8 | 132.4 | 2 542 | 1.4 | 43.0 | 1.86 | 1.8 | 71.9 | 20.8 | 478.6 | 4.3% |
| Jan 14, 2018 | 14 371 | 11.1 | 241.4 | 1 397 | 4.8 | 135.5 | 2 687 | 1.0 | 45.4 | 2.02 | 2.0 | 78.2 | 18.9 | 500.6 | 3.8% |
| Jan 13, 2018 | 13 952 | 12.8 | 234.4 | 1 270 | 5.7 | 123.2 | 2 618 | 1.2 | 44.3 | 2.05 | 2.1 | 79.5 | 21.9 | 481.3 | 4.5% |
| Jan 12, 2018 | 13 454 | 12.1 | 226.0 | 1 158 | 5.2 | 112.3 | 2 476 | 1.1 | 41.9 | 1.94 | 3.3 | 75.2 | 21.7 | 455.3 | 4.8% |
| Jan 11, 2018 | 14 968 | 16.5 | 251.4 | 1 268 | 7.2 | 122.9 | 2 892 | 1.9 | 48.9 | 1.98 | 6.3 | 76.7 | 32.0 | 499.9 | 6.4% |
| Jan 10, 2018 | 14 589 | 18.5 | 245.0 | 1 300 | 9.2 | 126.0 | 2 390 | 2.6 | 40.4 | 2.13 | 4.8 | 82.5 | 35.1 | 493.9 | 7.1% |
| Jan 9, 2018 | 15 124 | 16.7 | 253.9 | 1 146 | 8.0 | 111.0 | 2 412 | 1.1 | 40.8 | 2.44 | 3.7 | 94.7 | 29.4 | 500.4 | 5.9% |
| Jan 8, 2018 | 16 476 | 18.4 | 276.6 | 1 158 | 8.5 | 112.2 | 2 787 | 1.4 | 47.1 | 3.36 | 3.3 | 130.3 | 31.6 | 566.2 | 5.6% |
| Jan 7, 2018 | 17 527 | 15.9 | 294.2 | 1 043 | 5.6 | 101.0 | 2 785 | 1.4 | 47.1 | 3.09 | 2.4 | 119.8 | 25.3 | 562.1 | 4.5% |
| Jan 6, 2018 | 17 462 | 18.3 | 293.1 | 995 | 4.7 | 96.3 | 2 584 | 1.7 | 43.7 | 3.02 | 2.8 | 117.0 | 27.4 | 550.1 | 5.0% |
| Jan 5, 2018 | 15 477 | 23.8 | 259.7 | 976 | 6.7 | 94.4 | 2 401 | 2.1 | 40.6 | 3.30 | 6.3 | 127.9 | 38.9 | 522.6 | 7.4% |
| Jan 4, 2018 | 15 271 | 21.8 | 256.3 | 962 | 6.5 | 93.0 | 2 609 | 5.4 | 44.1 | 3.12 | 8.1 | 120.8 | 41.8 | 514.1 | 8.1% |
| Jan 3, 2018 | 14 978 | 16.9 | 251.3 | 886 | 5.1 | 85.7 | 2 701 | 4.7 | 45.6 | 2.46 | 6.6 | 95.5 | 33.3 | 478.1 | 7.0% |
| Jan 2, 2018 | 13 625 | 16.8 | 228.6 | 772 | 5.8 | 74.7 | 2 435 | 1.8 | 41.1 | 2.37 | 3.2 | 91.8 | 27.6 | 436.2 | 6.3% |
| Jan 1, 2018 | 14 112 | 10.3 | 236.7 | 756 | 2.6 | 73.1 | 2 535 | 0.9 | 42.8 | 2.30 | 1.9 | 88.9 | 15.7 | 441.6 | 3.6% |
* Data as of January 29, 2018, 00:00 UTC
** Data source: coinmarketcap.com
The 24-hour trading volumes (Volume 24h) for the eight dominant cryptocurrencies (Bitcoin, Ethereum, Bitcoin Cash, Ripple, Litecoin, Stellar, NEO, and Cardano) equaled $16.8 billion at the end of last week (Table 1.5.b), i.e. 4% of their market capitalization. The ZAK-4 Crypto and ZAK-8 Crypto indices are considered in more detail in Tables 1.5.a and 1.5.b.
Table 1.5.b. Daily ZAK-8 Crypto index calculation (continuation of Table 1.5.а)
| Crypto | Stellar (XLM) | Cardano (ADA) | NEO (NEO) | Litecoin (LTC) | 8 Crypto | ||||||||||
| Price Open | Volume (24h) | Market cap | Price Open | Volume (24h) | Market cap | Price Open | Volume (24h) | Market cap | Price Open | Volume (24h) | Market cap | Volume (24h) | Market cap | ZAK-8 Crypto index | |
| Date | $ | USD billion | USD billion | $ | USD billion | USD billion | $ | USD billion | USD billion | $ | USD billion | USD billion | USD billion | USD billion | % |
| Jan 28, 2018 | 0.62 | 0.19 | 11.0 | 0.621 | 0.3 | 16.1 | 140.4 | 0.25 | 9.1 | 181 | 0.4 | 10.0 | 16.8 | 422.6 | 4.0% |
| Jan 27, 2018 | 0.63 | 0.22 | 11.3 | 0.623 | 0.3 | 16.2 | 138.1 | 0.21 | 9.0 | 177 | 0.3 | 9.7 | 12.8 | 411.2 | 3.1% |
| Jan 26, 2018 | 0.60 | 0.79 | 10.8 | 0.634 | 0.8 | 16.4 | 137.8 | 0.32 | 9.0 | 180 | 0.4 | 9.9 | 18.3 | 416.2 | 4.4% |
| Jan 25, 2018 | 0.57 | 0.63 | 10.1 | 0.629 | 0.7 | 16.3 | 138.1 | 0.32 | 9.0 | 182 | 0.4 | 10.0 | 16.4 | 421.8 | 3.9% |
| Jan 24, 2018 | 0.49 | 0.67 | 8.7 | 0.563 | 0.7 | 14.6 | 122.6 | 0.43 | 8.0 | 178 | 0.4 | 9.8 | 18.4 | 400.3 | 4.6% |
| Jan 23, 2018 | 0.48 | 0.21 | 8.5 | 0.567 | 0.4 | 14.7 | 123.4 | 0.26 | 8.0 | 180 | 0.4 | 9.9 | 18.1 | 402.6 | 4.5% |
| Jan 22, 2018 | 0.47 | 0.44 | 8.3 | 0.615 | 0.5 | 15.9 | 132.3 | 0.35 | 8.6 | 192 | 0.5 | 10.5 | 19.5 | 425.8 | 4.6% |
| Jan 21, 2018 | 0.53 | 0.16 | 9.6 | 0.710 | 0.8 | 18.3 | 150.2 | 0.35 | 9.8 | 211 | 0.5 | 11.6 | 18.7 | 473.7 | 4.0% |
| Jan 20, 2018 | 0.51 | 0.20 | 9.1 | 0.660 | 0.7 | 17.0 | 140.5 | 0.50 | 9.1 | 194 | 0.5 | 10.7 | 21.2 | 434.1 | 4.9% |
| Jan 19, 2018 | 0.50 | 0.21 | 9.0 | 0.650 | 0.6 | 16.8 | 141.3 | 0.49 | 9.2 | 191 | 0.6 | 10.5 | 21.1 | 428.3 | 4.9% |
| Jan 18, 2018 | 0.48 | 0.47 | 8.6 | 0.630 | 1.3 | 16.4 | 142.6 | 0.84 | 9.3 | 187 | 0.9 | 10.2 | 34.6 | 411.6 | 8.4% |
| Jan 17, 2018 | 0.44 | 0.49 | 7.9 | 0.620 | 1.7 | 16.2 | 144.7 | 1.59 | 9.4 | 190 | 1.4 | 10.4 | 41.3 | 414.8 | 10.0% |
| Jan 16, 2018 | 0.60 | 0.47 | 10.7 | 0.780 | 1.6 | 20.2 | 188.0 | 1.66 | 12.2 | 233 | 1.4 | 12.8 | 39.8 | 519.6 | 7.7% |
| Jan 15, 2018 | 0.63 | 0.35 | 11.2 | 0.800 | 1.0 | 20.6 | 170.1 | 1.46 | 11.1 | 237 | 0.6 | 13.0 | 24.2 | 534.5 | 4.5% |
| Jan 14, 2018 | 0.67 | 0.12 | 12.0 | 0.882 | 0.2 | 22.9 | 140.6 | 0.65 | 9.1 | 261 | 0.9 | 14.3 | 20.7 | 558.9 | 3.7% |
| Jan 13, 2018 | 0.68 | 0.19 | 12.2 | 0.917 | 0.3 | 23.8 | 124.2 | 0.46 | 8.1 | 237 | 1.0 | 13.0 | 23.8 | 538.3 | 4.4% |
| Jan 12, 2018 | 0.56 | 0.39 | 10.0 | 0.696 | 0.4 | 18.0 | 109.2 | 0.23 | 7.1 | 230 | 0.7 | 12.6 | 23.4 | 503.0 | 4.7% |
| Jan 11, 2018 | 0.56 | 0.33 | 10.1 | 0.792 | 0.2 | 20.5 | 123.1 | 0.27 | 8.0 | 252 | 1.1 | 13.8 | 33.9 | 552.2 | 6.1% |
| Jan 10, 2018 | 0.59 | 0.25 | 10.5 | 0.816 | 0.2 | 21.2 | 127.2 | 0.36 | 8.3 | 248 | 1.0 | 13.6 | 37.0 | 547.4 | 6.8% |
| Jan 9, 2018 | 0.63 | 0.21 | 11.2 | 0.898 | 0.2 | 23.3 | 102.1 | 0.53 | 6.6 | 255 | 0.9 | 13.9 | 31.3 | 555.4 | 5.6% |
| Jan 8, 2018 | 0.70 | 0.25 | 12.4 | 0.999 | 0.3 | 25.9 | 102.1 | 0.23 | 6.6 | 288 | 1.2 | 15.7 | 33.5 | 626.9 | 5.3% |
| Jan 7, 2018 | 0.71 | 0.35 | 12.7 | 1.020 | 0.2 | 26.6 | 101.1 | 0.20 | 6.6 | 296 | 1.1 | 16.2 | 27.1 | 624.1 | 4.3% |
| Jan 6, 2018 | 0.66 | 0.44 | 11.9 | 0.997 | 0.3 | 25.8 | 95.3 | 0.19 | 6.2 | 250 | 2.3 | 13.6 | 30.6 | 607.6 | 5.0% |
| Jan 5, 2018 | 0.74 | 0.73 | 13.2 | 1.170 | 0.5 | 30.4 | 98.9 | 0.29 | 6.4 | 241 | 1.7 | 13.2 | 42.2 | 585.8 | 7.2% |
| Jan 4, 2018 | 0.89 | 0.89 | 16.0 | 1.090 | 0.6 | 28.4 | 104.8 | 0.33 | 6.8 | 245 | 3.5 | 13.4 | 47.1 | 578.7 | 8.1% |
| Jan 3, 2018 | 0.56 | 1.51 | 10.1 | 0.780 | 0.7 | 20.2 | 90.3 | 0.29 | 5.9 | 256 | 3.2 | 14.0 | 39.0 | 528.2 | 7.4% |
| Jan 2, 2018 | 0.50 | 0.68 | 8.9 | 0.725 | 0.3 | 18.8 | 78.5 | 0.37 | 5.1 | 229 | 1.2 | 12.5 | 30.2 | 481.4 | 6.3% |
| Jan 1, 2018 | 0.36 | 0.67 | 6.4 | 0.719 | 0.2 | 18.6 | 76.2 | 0.14 | 5.0 | 232 | 0.6 | 12.6 | 17.3 | 484.2 | 3.6% |
Table 1.6 gives a list of events, information on which appeared last week, which could impact both the prices of specific cryptocurrencies and the market in general.
Table 1.6. Events that could have an influence on cryptocurrency prices in the future
|
№ |
Factors and events
(link to source) |
Date of news | Date of event* | Description | Nature of impact | Type of impact |
| 1. | Big Risks in ICO Market: Flawed Token Valuations, Unclear Regulations, Heightened Hacker Attention and Congested Networks [source: EY.COM] | January 22, 2018 | n/a | The report of the international audit and advisory firm EY points out a number of negative aspects associated with the ICO market that could impact the entire industry in the future. For example, the report states that around 10% of all funds collected during ICOs were stolen by hackers. The report also notes that the valuation of many tokens is related more to the unwillingness of buyers to miss out on potential benefit than on an in-depth analysis of a project’s potential. Finally, the report demonstrates that many businesses do not really have any need to issue tokens. | Market ⇓ | Unfavorable |
| 2. | Lightning Network Shows Progress Developing Lightning Nodes [source: Coinspeaker] | January 22, 2018 | n/a | This solution to bitcoin’s scalability problem is gaining traction, with more and more services starting to support it. This is good news for bitcoin, as scalability is bitcoin’s most pressing problem in 2018. | BTC ⇑ | Favorable |
| 3. | Indians Expect Clarity on Bitcoin Taxes within Days [source: Bitcoin.com] | January 28, 2018 | n/a | In the near future the Indian government plans to give clear information on the taxation of cryptocurrencies, which could clear up the current uncertainty. However, the impact of this news on the market is unclear and depends to a great extent on the size of the future tax. | Market | Uncertain |
* Event will happen in the future (date, year, n/a – not available)
1.2 Market trends
The weekly cryptocurrency and digital asset market trends from October 1, 2017, to January 28, 2018, are presented as graphs (Fig. 1.1-1.5)*.
Table 1.7. Legends and descriptions of the figures
| Global Figures | Figure** | Description |
| Total cryptocurrency market capitalization, USD million | Fig. 1.1 | This figure shows cryptocurrency and digital asset market capitalization trends from October 1, 2017. |
| The rate of market change (as a % to the beginning of 2017) | Fig. 1.1 | This figure shows the % change in cryptocurrency and digital asset market capitalization compared to January 1, 2017. |
| Change in the market capitalization (in USD million compared to previous period) | Fig. 1.2 | This figure shows the weekly change in USD million (increase or decrease) in cryptocurrency and digital asset market capitalization from October 1, 2017. |
| The rate of market change (as a % compared to the previous period) | Fig. 1.2 | This figure shows the % of weekly change (increase or decrease) in cryptocurrency and digital asset market capitalization from October 1, 2017. |
| Number of cryptocurrencies and digital assets | Fig.1.3 | This figure shows the trends in the increase of the number of cryptocurrencies and digital assets circulating on cryptocurrency exchanges. On January 1, 2017, their number was 617, and as of January 28, 2018, this number had already reached 1,474. |
| Average market capitalization, USD million | Fig. 1.3 | This figure reflects the growth in the average cryptocurrency and digital asset market capitalization from October 1, 2017, i.e. the ratio between the market capitalization of all cryptocurrencies and digital assets and their number. |
| Forecast of total cryptocurrency market capitalization | Fig. 1.4, 1.5 | This figure shows the time trend (forecast) change in cryptocurrency and digital asset market capitalization. |
* Data as of January 29, 2018, 00:00 UTC
** The figures below present average data for 24 hours
Data source: coinmarketcap.com
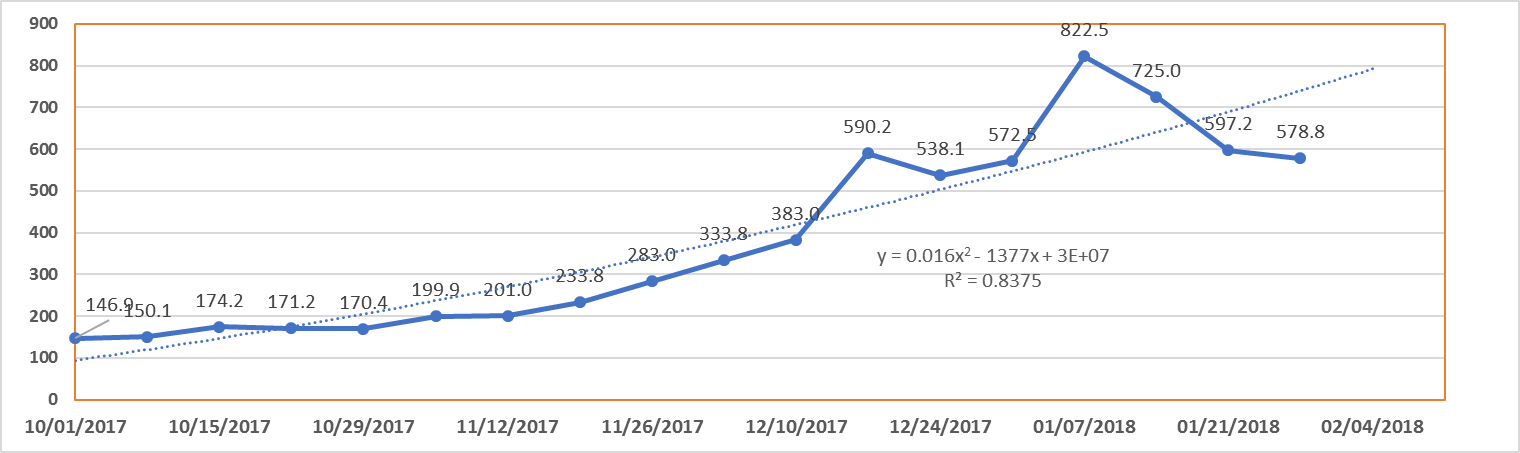
Figure 1.1. Total cryptocurrency market capitalization*
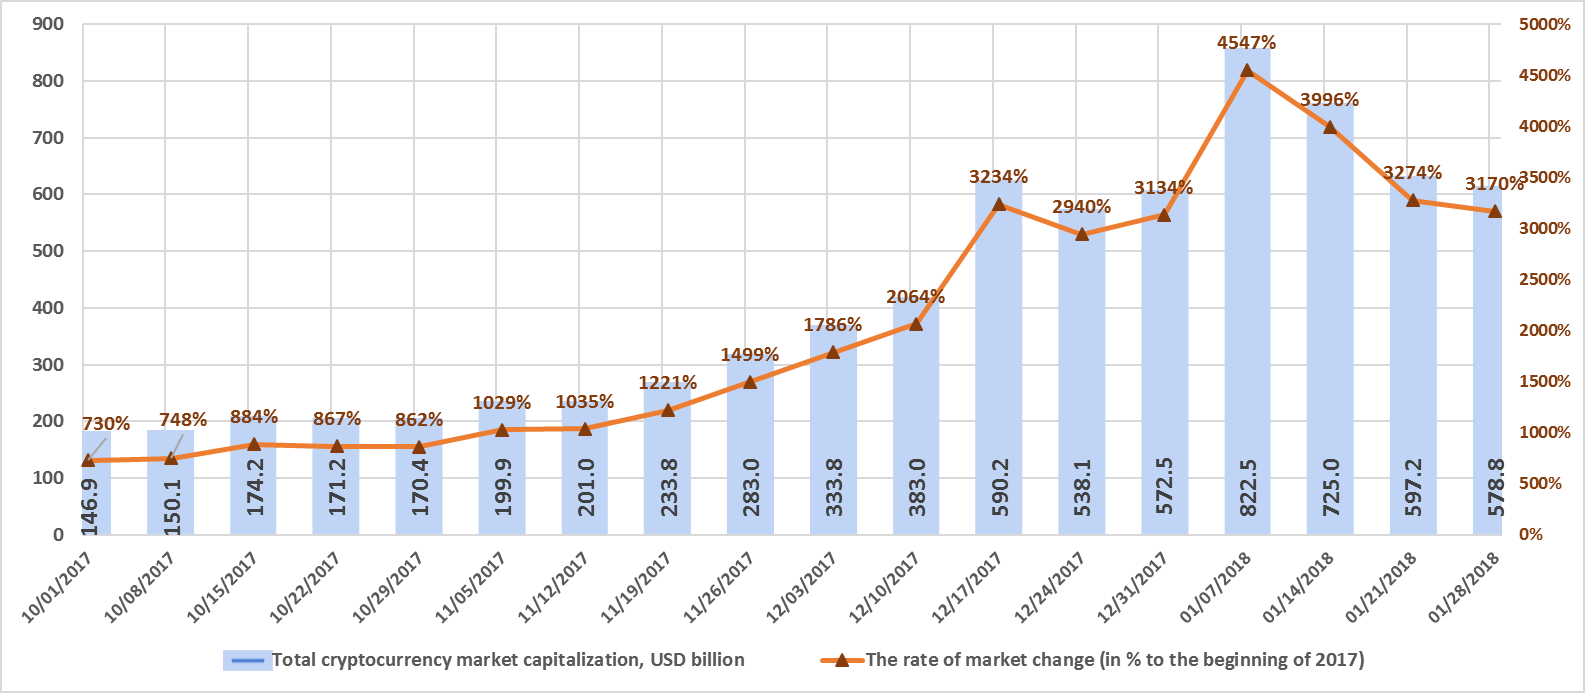
* Average daily data (according to the data of coinmarketcap.com).
Figure 1.1 shows a graph of the weekly cryptocurrency market change from October 1, 2017, to January 28, 2018. Over this period, market capitalization increased from $146.9 billion to $578.8 billion, a growth of 3,170% relative to the start of 2017. Over the first week of January 2018, total market capitalization exceeded $800 billion for the first time, but over the following three weeks (January 8-28, 2018) total market capitalization decreased from $822.5 billion to $578.8 billion (as of January 28, 2018, based on the average figures from coinmarketcap.com).
Figure 1.2. Change in market capitalization
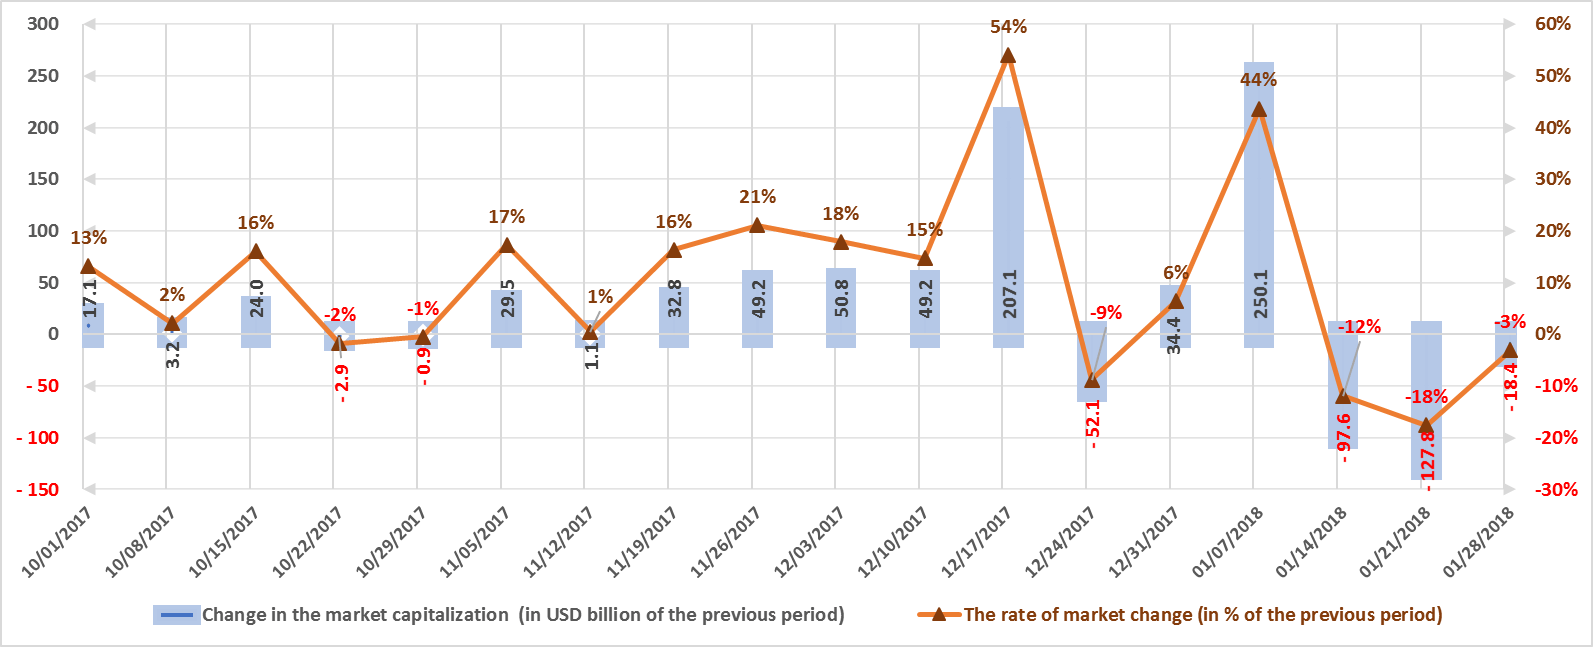
Despite the significant growth in cryptocurrency market capitalization in Q3 2017 and over the entire year, the market is susceptible to sudden and drastic fluctuations. The highest growth rate in Q4 2017 was around $200 billion, or 54%, during the week of December 17-24, 2017. During the first week of January, market capitalization increased by approximately $250 billion, or 44%, but over the following three weeks decreases of approximately $100 billion, $130 billion, and $20 billion, respectively, were seen (with due account of average daily data, see fig. 1.2).
Figure 1.3. Number of cryptocurrencies and digital assets
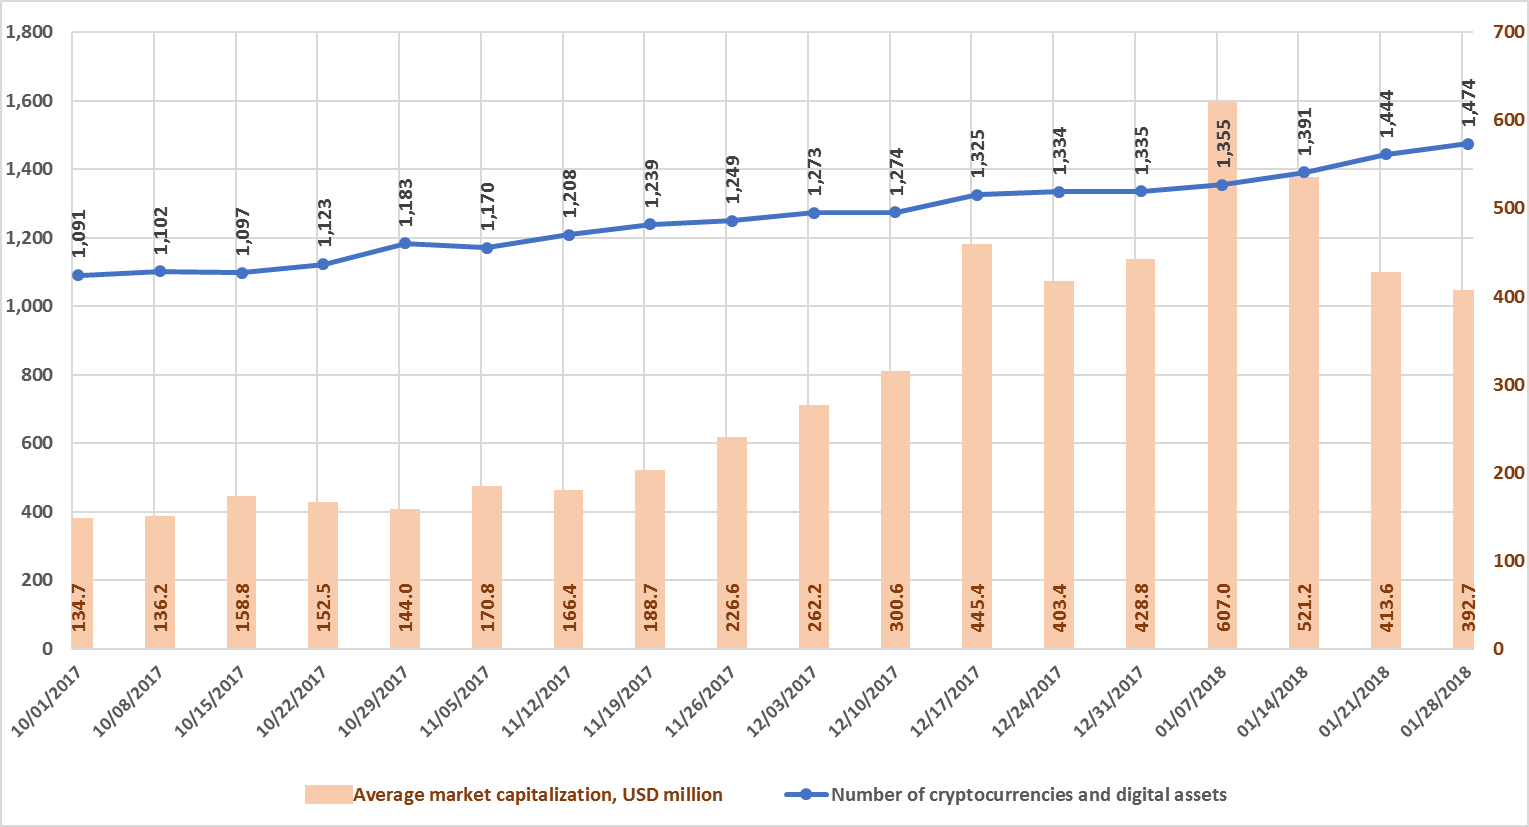
The total number of cryptocurrencies and digital assets listed on exchanges has grown since the start of October from 1,091 to 1,474. Their number increased by 30 over the past week alone, from 1,444 to 1,474. In this regard, over the past three weeks average cryptocurrency and digital asset capitalization has decreased from $607 million to $392.7 million.
Figures 1.4 and 1.5. Forecast of total cryptocurrency market capitalization
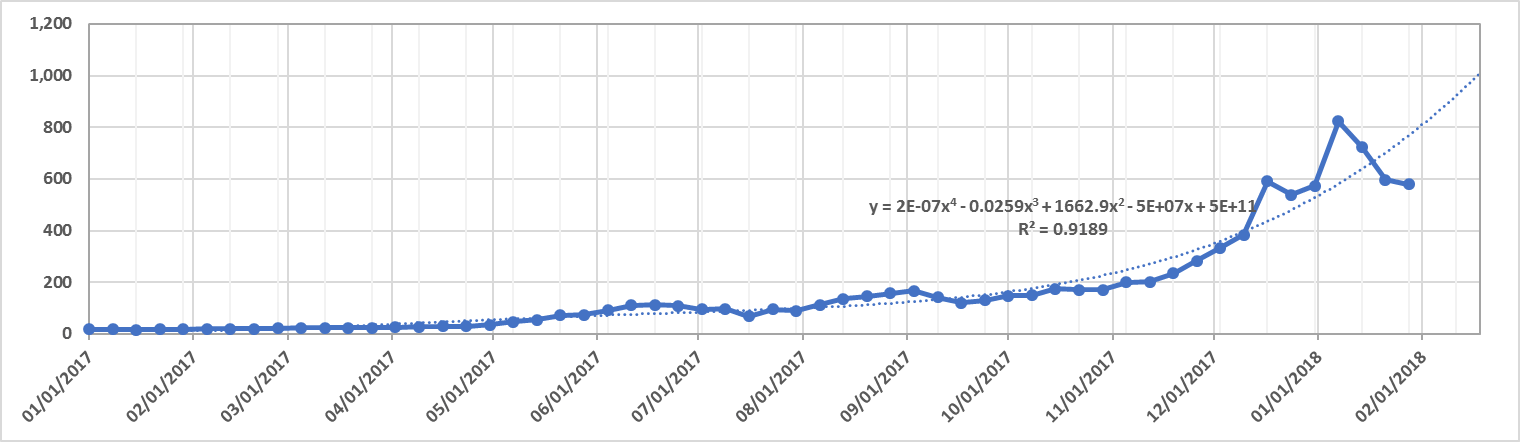
The market has fallen for three weeks in a row. However, last week the rate of reduction slowed and the severity of the reaction to the events in South Korea softened, giving hope that the “bear” market trend may be replaced with a more optimistic outlook. This is supported by the data provided by the Cboe and CME exchanges and published by CFTC (the Commodity Futures Trading Commission) in its weekly report on futures trading. It follows from these data that on January 23, 2018, the number of “long” contracts on the Cboe, which reflects its clients’ expectation of a growth in prices, was approximately double that of “short” contracts, which reflect their expectation of a drop in prices. If you compare these data with the data for the previous five weeks, when the situation was the opposite, i.e. the Cboe had more “short” contracts, it is safe to say that most of the traders on this exchange expect a growth in the Bitcoin price.
2. General analysis of the ICO market (by week, month).
2.1Brief market overview, news of the week
- Top 5 Blockchain-Based Startups to Look Out for in 2018 [source: Coinspeaker]
- Arsenal FС Enters into World-First Crypto Partnership to Promote CashBet’s ICO [source: Coinspeaker]
- Is Starbucks having an ICO? [source: Сryptocoinsnews]
- The SEC on ICOs and Cryptocurrency: A Rocky but Optimistic Ride [source: Сryptocoinsnews]
- A Trio of VCs Pledge Millions to Telegram Pre-ICO: Reports [source: Сryptocoinsnews]
- Chinese Finance Association Cautions on Overseas ICOs [source: Сoindesk]
- Russian Finance Ministry Proposes Draft Law on ICO Regulation [source: Сoindesk]
- Philippines SEC Plans to Regulate Cryptocurrencies, ICOs [source: Сoindesk]
2.2. Aggregated trends and performance indicators of past (completed) ICOs
A set of tools is proposed to assess the trends and performance of successfully completed and/or listed ICOs (see Table 2.1).
Table 2.1. Tools to assess the market performance of successfully completed and/or listed ICOs
| Indicator | Description |
| Average collected funds (ACF) | Average amount of funds collected per ICO project over the period (month, quarter, year). |
| Average token performance (ATP) | Average performance of funds spent on buying tokens or average ratio between the current token price and token sale price over the period (month, quarter, year), i.e. the average reward per $1 spent on buying tokens during the token sale, if they are traded on exchanges for USD. |
| Weighted average current reward on ICO funds (WACRF) | Average weighted current performance of funds spent on buying tokens over the period (month, quarter, year). This indicator is similar to the previous indicator Average token performance (ATP), but is calculated taking into consideration the weight of the indicator. The parameter “average collected funds” (ACF) is used as a weight. |
| Weighted average monthly reward on ICO funds (WAMRF) | Average weighted monthly performance of funds spent on buying tokens over the period (month, quarter, year). This indicator is similar to the previous indicator, Weighted average current reward on ICO Funds (WACRF), but is calculated based on recalculated average monthly performance. |
Table 2.2. Aggregated trends and performance indicators of past (completed) ICOs4
| Indicator | Total
2017 |
Dec
2017 |
Jan 1-7,
2018 |
Jan 8-14,
2018 |
Jan 15-21,
2018 |
Jan 22-28,
2018 |
| Total amount of funds collected, USD million1 | 6 037.7 | 1 627.1 | 294.6 | 301.7 | 449.3 | 269.2 |
| Number of companies that completed an ICO1 | 382 | 74 | 17 | 17 | 19 | 15 |
| Maximum collected, USD million (ICO name) | 258
(Hdac) |
258
(Hdac) |
51.8 (Neuromation) | 60.3
(Olympus Labs) |
100
(Envion) |
57.9
(Elastos) |
| Average collected funds, USD million | 15.8 | 22 | 17.3 | 17.7 | 23.6 | 17.9 |
| Max token reward (ICO name) | 6 398.61x (Spectrecoin) | 10.56х
(Aelf) |
5.59x
(Lamden) |
2.54x
(Selfkey) |
3.73x
(DATA) |
1.61x (Blockport) |
| Average token reward (ATR)2 | 47.86x | 13.04x | 2.37x | 1.18x | 2.32x | 1.61x |
| Weighted average current reward on funds (WACRF)3 | 9.91x | 9.03x | 1.03x | 0.84x | 2.09x | 1.61x |
Notes:
1 Data source: tokendata.io, icodrops.com, icodata.io, coinschedule.com. Only popular and/or successfully completed ICOs (i.e. ICOs which managed to collect the minimum set amount of funds) and/or ICOs listed on exchanges were considered. For some ICOs information may currently be incomplete (for instance, the amount of funds collected).
2 Average token reward on ICO projects during 2017 and 2018. For example, token reward or the ratio between the current token price and the token sale price, i.e. the average reward per USD 1 spent on tokens during the token sale, if they are subsequently listed for USD on a cryptocurrency exchange, equals $47.86 for projects completed in 2017. To calculate this ratio, the authors used the data from 382 ICOs completed in 2017. The maximum token reward for projects completed in 2017 was 6,398.61x for the Spectrecoin ICO (based on the assessment made on January 4, 2018).
3 Weighted average current reward on funds (WACRF) is an indicator similar to Average token reward (ATR), but takes into consideration the weight of the amount of funds collected through an ICO (see the Glossary).
4 The data for many ICOs are incomplete or non-existent.
The data for January 15-21, 2018, were adjusted to account for the appearance of more complete information on past ICOs. Last week (January 22-28, 2018) the amount of funds collected via ICOs equaled $269.2 million. This amount includes the results of the 15 most successful completed ICOs, with the largest amount collected equaling around $57.9 million (Elastos ICO). The average amount of funds collected per project was $17.9 million. More detailed information on the 15 main ICOs completed over the past week is given in Table 2.5.
2.3. Aggregated indicators to assess the market of active and planned ICOs
Table 2.3. Aggregated indicators to assess the market of active and planned ICOs
| Indicator | Value |
| Number of projects conducting an active ICO as of the current date (January 28, 2018) | 253 |
| Number of projects planning an ICO as of the current date (January 28, 2018) | 154 |
| Number of projects planning an ICO between January 29-February 4, 2018 | 31 |
Data source: tokendata.io, icodata.io, coinschedule.com, coingecko.com, icodrops.com, smithandcrown.com and icoalert.com
The number of projects conducting active ICOs as of January 28, 2018, is 243. There is presently information available on at least 154 planned ICOs to be conducted after January 28, 2018, including at least 31 ICOs which will start next week.
2.4. Quantitative analysis of the ICO market
2.4.1 Amount of funds collected and number of ICOs
Table 2.4. Amount of funds collected and number of ICOs
| Month | Collected, $ million | Number of ICOs* | Average collected, $ million |
| January | 4.5 | 3 | 1.5 |
| February | 9.7 | 5 | 1.94 |
| March | 4.7 | 3 | 1.57 |
| April | 127.8 | 17 | 7.52 |
| May | 168.4 | 16 | 10.53 |
| June | 995.2 | 30 | 33.17 |
| July | 461.3 | 29 | 15.91 |
| August | 330 | 35 | 9.43 |
| September | 730.3 | 45 | 16.23 |
| October | 794.2 | 68 | 11.7 |
| November | 683.5 | 50 | 13.7 |
| December | 1 627.1 | 74 | 22 |
| January 1-7, 2018 | 294.6 | 17 | 17.3 |
| January 8-14, 2018 | 301.7 | 17 | 17.7 |
| January 15-21, 2018 | 449.3 | 19 | 23.6 |
| January 22-28, 2018 | 269.2 | 15 | 17.9 |
| Total | 7 352.5 | 450 | 16.3 |
* Information on funds collected is not available for all ICOs (information for last week is tentative and may be adjusted).
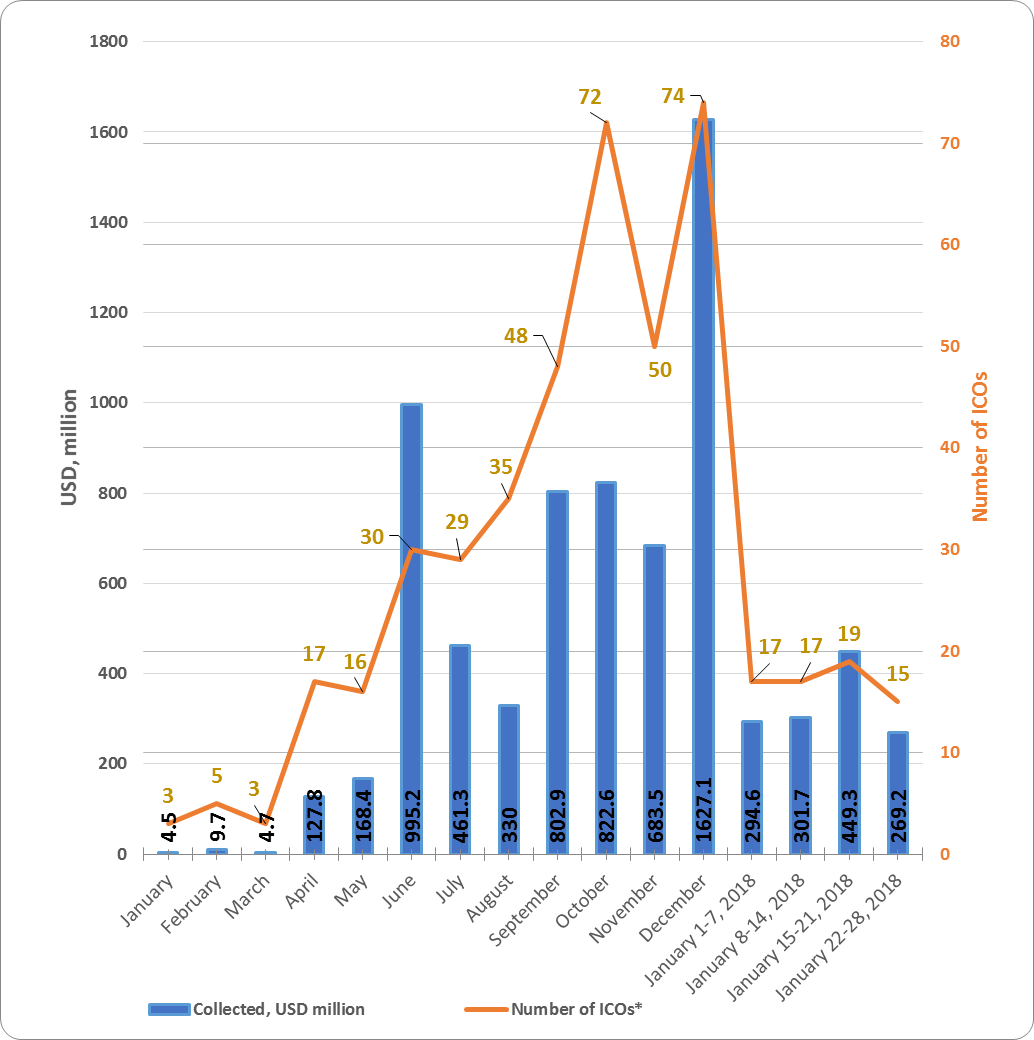
Table 2.4 shows that the greatest amount of funds was collected via ICOs in December 2017. The average funds collected per ICO in that month equaled $22 million.
The data for last week (January 22-28, 2018) may be adjusted as information on the amounts of funds collected by completed ICOs is finalized.
Figure 2.1. Trends in funds collected and number of ICOs since the start of 2017
2.4.2 Top ICOs
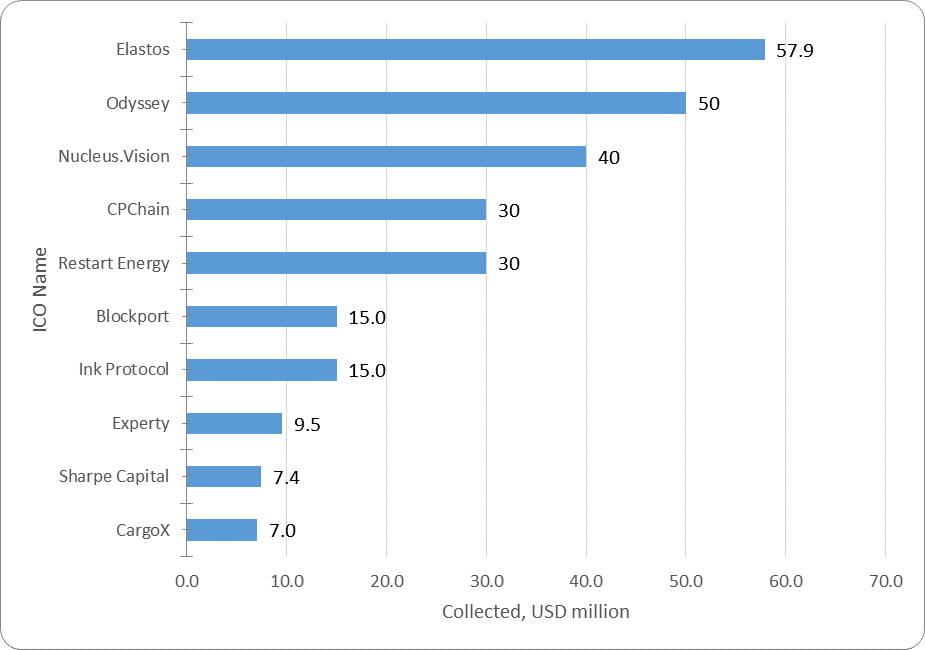
Table 2.5. Top 10 ICOs in terms of the amount of funds collected (January 22-28, 2018)
| № | Name of ICO*** | Category** | Collected, $ million | Date |
| 1 | Elastos | Infrastructure | 57.9 | January 23, 2018 |
| 2 | Odyssey | Infrastructure | 50 | January 23, 2018 |
| 3 | Nucleus.Vision | Infrastructure | 40 | January 28, 2018 |
| 4 | CPChain | Infrastructure | 30 | January 24, 2018 |
| 5 | Restart Energy | Energy & Utilities | 30 | January 23, 2018 |
| 6 | Blockport | Trading & Investment | 15 | January 24, 2018 |
| 7 | Ink Protocol | Commerce & Advertising | 15 | January 22, 2018 |
| 8 | Experty | Infrastructure | 9.5 | January 26, 2018 |
| 9 | Sharpe Capital | Trading & Investment | 7.4 | January 28, 2018 |
| 10 | CargoX | Supply & Logistics | 7 | January 23, 2018 |
| Top 10 ICOs | 261.8 | |||
| Total funds collected from January 22-28, 2018 (15 ICOs) | 269.2 | |||
| Average funds collected | 17.9 |
* The category was established based on expert opinions.
** When compiling the lists of top ICOs, information from the websites tokendata.io, icodrops.com, icodata.io, coinschedule.com and other specialized sources is used. The ICO project categories correspond to the information from the website coinschedule.com. If there is no information on the website concerning the project category at the time of compilation of this analytical report, the category is determined by experts.
*** Only popular and/or successfully completed ICOs (i.e. ICOs which managed to collect the minimum set amount of funds) and/or ICOs listed on exchanges were considered. Information may be incomplete for some ICOs (for instance, the amount of funds collected).
Table 2.5 shows the top 10 ICOs which were successfully completed over the past week (January 22-28, 2018). The leader for the week was the Chinese project Elastos, which aims to create a new type of decentralized internet.
Figure 2.2 presents the ten largest ICOs completed last week.
Figure 2.2. Top 10 ICOs in terms of the amount of funds collected (January 22-28, 2018)
2.4.3 Top ICOs in their categories
The list of top ICOs by category is compiled with due account of the categories of the leading ICOs for the week.
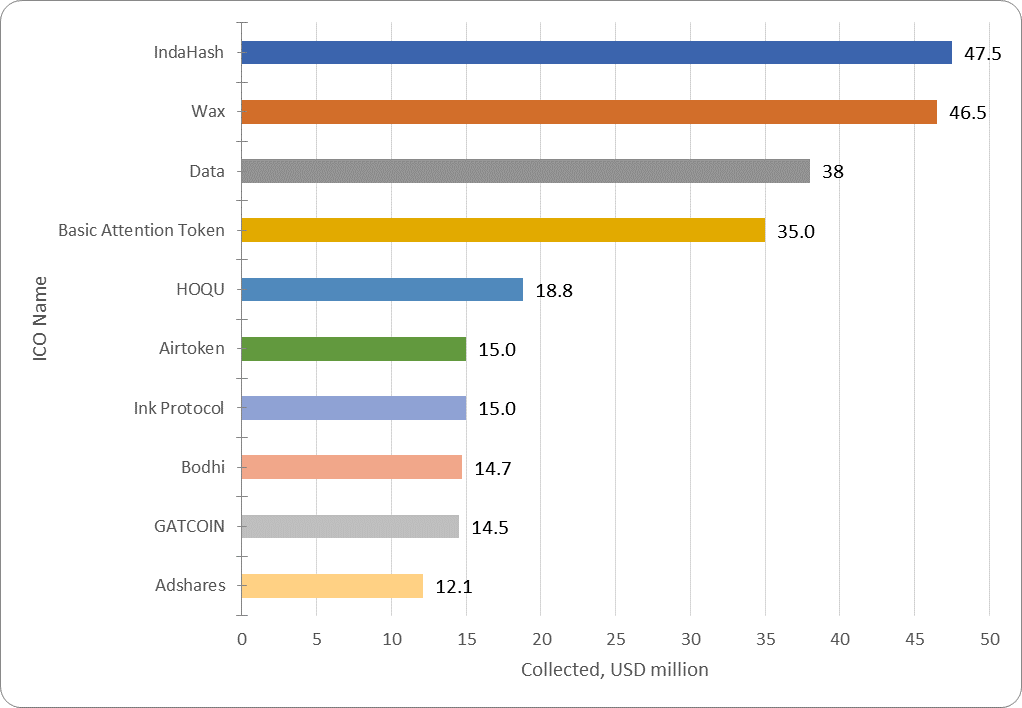
Table 2.6. Top 10 ICOs in terms of the amount of funds collected, Commerce & Advertising category
| № | Name of ICO | Category* | Collected, $ million | Date | Token performance |
| 1 | IndaHash | Commerce & Advertising* | 47.5 | December 20, 2017 | n/a |
| 2 | Wax | Commerce & Advertising* | 46.5 | November 15, 2017 | 5,09x |
| 3 | Data | Commerce & Advertising | 38 | January 21, 2018 | n/a |
| 4 | Basic Attention Token | Commerce & Advertising | 35 | May 31, 2017 | 16,59x |
| 5 | HOQU | Commerce & Advertising | 18.8 | January 11, 2018 | n/a |
| 6 | Airtoken | Commerce & Advertising | 15 | October 7, 2017 | 1,47x |
| 7 | Ink Protocol | Commerce & Advertising | 15 | January 22, 2018 | n/a |
| 8 | Bodhi | Commerce & Advertising* | 14.7 | November 22, 2017 | 2,7x |
| 9 | GATCOIN | Commerce & Advertising | 14.5 | January 14, 2018 | n/a |
| 10 | Adshares | Commerce & Advertising | 12.1 | January 12, 2018 | n/a |
* When compiling the lists of top ICOs, information from the websites tokendata.io, icodrops.com, icodata.io, coinschedule.com and other specialized sources is used. The ICO project categories correspond to the information from the website coinschedule.com. If there is no information on the website concerning the project category at the time of compilation of this analytical report, the category is determined by experts.
** The top projects in this category completed in January 2018 are highlighted in red.
At present, all projects from the top 10 in the Commerce & Advertising category have a token performance indicator of 1.47x to 16.59x. Half of the projects from the top 10 completed their ICOs in January 2018. The Basic Attention Token exchange listing can be considered one of the most successful ICOs, as this project has a current token price to token sale price ratio of 16.59x. When considering this indicator, it is important to remember that the Basic Attention Token ICO was completed on May 31, 2017, i.e. the 16.59x growth took place over more than seven months. The market capitalization of Basic Attention Token currently exceeds $600 million.
Figure 2.3. Top 10 ICOs in terms of the amount of funds collected, Commerce & Advertising category
The ratings of ICOs in the Infrastructure and Energy & Utilities categories are given below.
Table 2.7. Top 10 ICOs in terms of the amount of funds collected, Infrastructure category
| № | Name of ICO | Category* | Collected, $ million | Date | Token performance |
| 1 | Hdac | Infrastructure | 258 | December 23, 2017 | n/a |
| 2 | Tezos | Infrastructure | 232.3 | July 13, 2017 | n/a |
| 3 | EOS | Infrastructure | 185 | July 1, 2017 | 14.29x |
| 4 | The DAO | Infrastructure | 168 | May 28, 2016 | n/a |
| 5 | Bancor | Infrastructure | 153 | June 12, 2017 | 1.95x |
| 6 | Polkadot | Infrastructure | 144.3 | October 27, 2017 | n/a |
| 7 | Kin | Infrastructure | 97 | September 26, 2017 | 3.96x |
| 8 | Status | Infrastructure | 90 | June 20, 2017 | 8.2x |
| 9 | Nebulas | Infrastructure | 60 | December 16, 2017 | 6.43x |
| 10 | Elastos | Infrastructure | 57.9 | January 23, 2018 | n/a |
* When compiling the lists of top ICOs, information from the websites tokendata.io, icodrops.com, icodata.io, coinschedule.com and other specialized sources is used. The ICO project categories correspond to the information from the website coinschedule.com. If there is no information on the website concerning the project category at the time of compilation of this analytical report, the category is determined by experts.
** The top projects in this category completed in January 2018 are highlighted in red.
Table 2.7 shows the top 10 ICOs in the Infrastructure category. Nearly all of these projects were performed in 2017. The leader for 2017 in this category was the Hdac project. The best token performance indicator, i.e. the best current token price to token sale price ratio, is 14.29x, and belongs to the EOS ICO. Its market capitalization currently exceeds $9 billion.
Figure 2.4. Top 10 ICOs in terms of the amount of funds collected, Infrastructure category
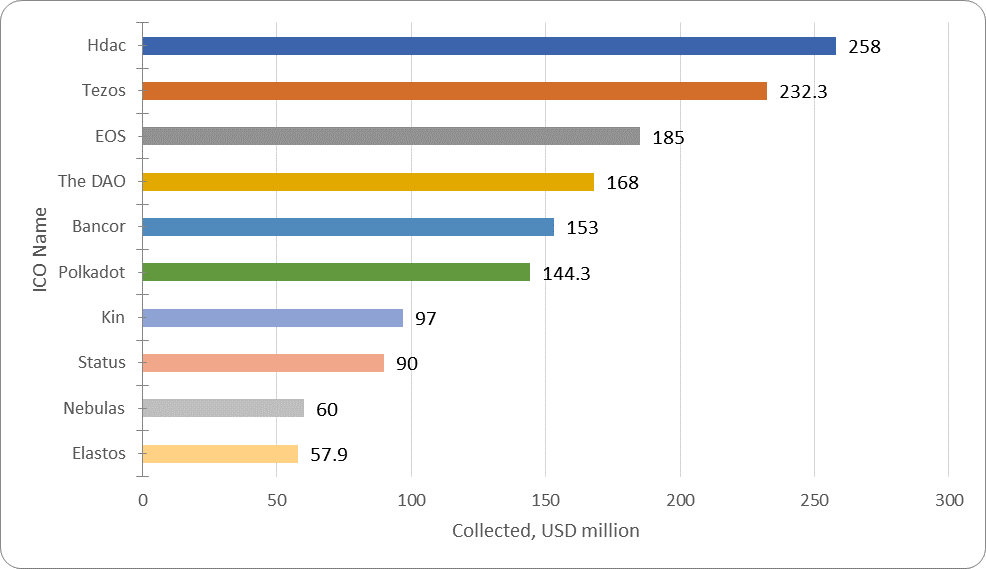
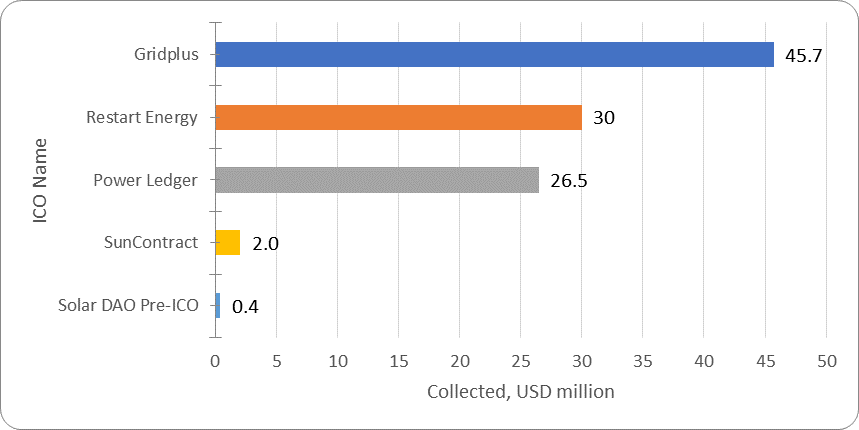
Table 2.8. Top 5 ICOs in terms of the amount of funds collected, Energy & Utilities category
| № | Name of ICO | Category* | Collected, $ million | Date | Token performance |
| 1 | Gridplus | Energy & Utilities | 45.7 | November 11, 2017 | n/a |
| 2 | Restart Energy | Energy & Utilities | 30 | January 23, 2018 | n/a |
| 3 | Power Ledger | Energy & Utilities | 26.5 | October 6, 2017 | 9,4x |
| 4 | SunContract | Energy & Utilities | 2 | January 8, 2017 | 21,05x |
| 5 | Solar DAO Pre-ICO | Energy & Utilities | 0.4 | September 7, 2017 | n/a |
* When compiling the lists of top ICOs, information from the websites tokendata.io, icodrops.com, icodata.io, coinschedule.com and other specialized sources is used. The ICO project categories correspond to the information from the website coinschedule.com. If there is no information on the website concerning the project category at the time of compilation of this analytical report, the category is determined by experts.
** The top projects in this category completed in January 2018 are highlighted in red.
Table 2.8 shows the top 5 ICOs in the Energy & Utilities category, one of which was completed last week.
Figure 2.5. Top 5 ICOs in terms of the amount of funds collected, Energy & Utilities category
Over the past period (January 22-28, 2018), 15 ICO projects were successfully completed, each of which collected more than $100,000, with a total amount of funds collected of around $269.2 million. The leader of the past week of January 2018 was the Elastos project ($57.9 million). The total amount of funds collected by a number of ICOs failed to reach even the $100,000 mark (the information for some projects is still being finalized).
The Glossary is given in Annex 1.
Annex 1 – Glossary
| Key terms | Definition |
| Initial coin offering, ICO | A form of collective support of innovative technological projects, a type of presale and attracting of new backers through initial coin offerings to future holders in the form of blockchain-based cryptocurrencies (tokens) and digital assets. |
| Market capitalization | Value of an asset calculated based on its current market (exchange) price. This economic indicator is used to assess the total aggregate value of market instruments, players, and markets. [Source: https://en.wikipedia.org]. |
| Cryptocurrency market capitalization | Aggregate market value of cryptocurrencies circulating on the market. |
| Total cryptocurrency market capitalization | Cryptocurrency and digital asset market capitalization, i.e. the aggregate market value of all cryptocurrencies and digital assets circulating on the market. |
| Token reward | Token performance (current token price / token sale price during the ICO), i.e. the reward per $1 spent on buying tokens. |
| Dominance | Market share, i.e. the ratio of market capitalization of a particular cryptocurrency (token) to total cryptocurrency market capitalization. Expressed as a %. |
| Token sale price
Current token price |
Token sale price during the ICO.
Current token price. |
| Not Mineable
|
A coin that is not mineable. The term is used for cryptocurrencies (tokens) which cannot be mined or issued through mining. |
| Pre-mined | A pre-mined coin. The term is used for cryptocurrencies (tokens) which are issued through mining, and a certain number of coins (tokens) have been created and distributed among certain users at the start of the project. |
| The rate of market increase (as a % compared to the beginning of the year) | The rate of market increase (as a % compared to the start of the year), i.e. by how many % points did market capitalization increase compared to the start of the year. |
| The growth rate of the market (as a % compared to the beginning of the year) | The market growth (as a % compared to the start of the year), i.e. by how many times did market capitalization grow compared to the start of the year. |
| Increase in market capitalization (in USD million compared to the previous period) | Increase in cryptocurrency and digital asset market capitalization (in USD million compared to the previous period), i.e. by how many USD million did market capitalization increase over the period. |
| The rate of market increase (as a % compared to the previous period) | Rate of market increase (as a % compared to the previous period), i.e. by how many % points did market capitalization increase over the period. |
| The market growth rate (as a % compared to the previous period) | Market growth rate (as a % compared to the previous period), i.e. by how many times did market capitalization grow compared to the previous period. |
| Number of cryptocurrencies and digital assets | Number of cryptocurrencies and digital assets. At the time when this glossary was compiled over 1,070 cryptocurrencies and digital assets were circulating on the market. |
| Average market capitalization | Average market capitalization, i.e. the ratio of the market capitalization of all cryptocurrencies and digital assets to their number. |
| Token return | Performance of funds spent on buying tokens or the ratio of the current token price to the token sale price, i.e. performance of $1 spent on buying tokens during the token sale, if listed on an exchange for USD. |
| ETH reward – current dollar value of $1 spent on buying tokens during the token sale | Alternative performance indicator of funds spent on buying tokens during the ICO or the ratio of the current ETH rate to its rate at the start of the token sale, i.e. if instead of buying tokens $1 was spent on buying ETH at its rate at the start of the token sale and then it was sold at the current ETH rate. |
| BTC reward– current dollar value of $1 spent on buying tokens during the token sale | Similar to the above: Alternative performance indicator of funds spent on buying tokens during the token sale, i.e. if instead of buying tokens $1 was spent on buying BTC at its rate at the start of the token sale and then it was sold at the current BTC rate. |
| Token/ETH reward | This ratio describes the backer’s economic benefits and disadvantages resulting from buying tokens during the token sale relative to buying ETH. If the result is over 1, the backer spent his funds more efficiently on buying tokens than if he were to have spent his funds on ETH. |
| Token/BTC reward | This ratio describes the backer’s economic benefits and disadvantages resulting from buying tokens during the token sale relative to buying BTC. If the result is over 1, the backer spent his funds more efficiently on buying tokens than if he were to have spent his funds on BTC. |
| ZAK-n Crypto index | The index is calculated as a percentage and represents a ratio between the 24-hour trading volume (transactions) on cryptocurrency exchanges per day (Volume 24h) for n dominant cryptocurrencies to their total market capitalization.
ZAK-4 Crypto index calculations include four dominant cryptocurrencies with the greatest market capitalization: Bitcoin, Ethereum, Bitcoin Cash, and Ripple. ZAK-8 Crypto index calculations include the trading volume and market capitalization for eight cryptocurrencies. |
The post Cryptocurrency and ICO Market Analysis [January 22-28, 2018] appeared first on CoinSpeaker.